Asset Allocation Weekly (March 29, 2019)
by Asset Allocation Committee
Long-dated Treasury bonds have enjoyed a strong rally in recent weeks. Fears about future U.S. economic growth, falling global economic growth and a reversal in monetary policy expectations have all conspired to lower yields. The question now is whether or not yields have fallen more than is justified by the fundamental factors.
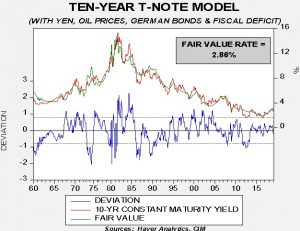
This is our model of the 10-year T-note yield. Independent variables in the model include fed funds, an inflation proxy,[1] the yen/dollar exchange rate, German 10-year yields, WTI oil prices and the fiscal deficit as a percentage of GDP. The standard error line is 70 bps; thus, at current fair value, the 10-year T-note yield would be “rich” around 2.15%.
In general, the first two variables have the most explanatory power. The current yield is well below the fair value of 2.86%.[2] One way to account for the decline in yields would be if the market was projecting easier monetary policy. Leaving the rest of the independent variables unchanged, to reach a 2.40% 10-year T-note yield would require fed funds of about 1.50%, or a 100 bps reduction from current levels. Since such a cut is unlikely in the near term, it is arguable that the 10-year yield has overshot to the downside.
However, another possibility is that inflation expectations are falling. Inflation expectations have a powerful effect on long-dated debt yields. Our current inflation proxy puts inflation at 2.10%. To achieve current yields, inflation expectations would need to fall to 1.41%. Although inflation expectations are not directly observable, we assume such expectations are slow to change.[3] Thus, it would be unlikely that a drop in inflation expectations alone would account for the recent decline. However, inflation expectations falling to 1.8% and fed funds at 2.00% would bring yields close to 1.40%.
It is quite possible that falling inflation expectations and forecasts of easier monetary policy can justify the current 10-year yields. The risk is that the FOMC keeps policy steady and inflation eventually surprises to the upside. Thus, we would not see the current environment as conducive for extending duration.
[1] We use a 15-year moving average of the yearly change in inflation for inflation expectations.
[2] We use monthly averages in the above model; thus, the March yield is 2.63%. The April yield will be much less.
[3] Milton Friedman assumed such expectations were built over a long period of time, perhaps two decades or more.


