Asset Allocation Weekly (April 18, 2019)
by Asset Allocation Committee
Why is inflation so low? The persistence of low inflation, despite the long expansion and the decline in unemployment, continues to befuddle policymakers. Standard economic theory suggests there is an inverse relationship between inflation and unemployment. When the unemployment rate is low, firms should be experiencing reduced excess capacity. As capacity is constrained, supply bottlenecks would be expected to develop which would eventually result in inflation.
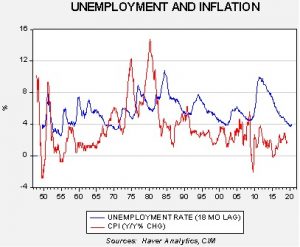
Although the unemployment/inflation theory makes sense, it doesn’t work all that well in real life.
This chart shows the level of unemployment, with an 18-month lag, compared to the yearly change in CPI. In the 1960s, it did appear there was a tradeoff; when unemployment fell, inflation rose 18 months later. However, even during this period, the data relationship was merely directional as sub-4% unemployment led to 6% CPI. In the mid-1970s, 4.5% unemployment led to CPI in excess of 12%. Since the early 1980s, CPI has rarely moved above 4%, and in the current environment sub-4% unemployment has not yet triggered a notable inflation problem.
It turns out inflation is rather complicated. Expectations play a major role; if households and businesses expect rising inflation, they take steps to protect themselves that exacerbate the inflation impulse. Both sectors will build inventory levels, effectively changing their balance sheet allocation from financial instruments to real goods. This action can lift the demand for goods and can trigger inflation.
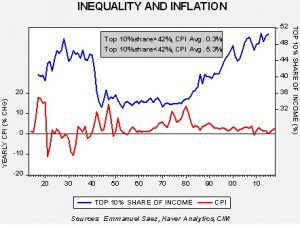
There also appears to be at least two long-term factors that affect inflation. Inequality seems to have an impact.
History shows that lower degrees of inequality are correlated with higher levels of inflation. We think there are two factors that cause this outcome. First, policies designed to expand supply, deregulation and globalization, tend to improve the efficiency of the economy at the expense of higher inequality. Outsourcing and automation make production more efficient but also reduce the demand for domestic labor. Simply put, one person’s efficiency is another person’s pink slip. Second, CPI is designed to measure prices based on an average household’s consumption patterns. With rising inequality, lower decile households may have less income to spend on basic items, making it difficult for firms to pass along price increases on such goods. On the other hand, under conditions of inequality, prices on luxury items are likely to be priced higher simply because there is more spending power available.[1]
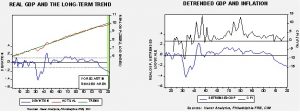
However, it is likely that the most potent reason inflation has stayed low is because of excess capacity in the economy. Measuring excess capacity is profoundly difficult because it is something of a moving target. A simple way is to regress long-term GDP against trend; the assumption is that the trend is a reasonable proxy for capacity.
The chart on the left is real GDP, log-transformed with a time trend regressed through it. The lower line is the deviation from trend. We are currently in a period where GDP is well below trend. The only other period that exhibited such a negative deviation from trend was the Great Depression. The chart on the right shows the GDP deviation line compared to CPI. Note that inflation tends to be low during periods of below-trend GDP. For the overall time frame (1921-2018), CPI averages 2.8%. When GDP is above trend, inflation averages 3.8%; when GDP is below trend, CPI averages 0.4%.
This trend analysis could mean that it may take several years before inflation pressures become notable if policymakers become aggressive with stimulation (i.e., keeping monetary policy accommodative while lifting fiscal policy). It also means the Federal Reserve can probably avoid raising rates for a considerable period.
[1] https://www.pewtrusts.org/en/research-and-analysis/issue-briefs/2016/03/household-expenditures-and-income


