Asset Allocation Weekly (May 31, 2019)
by Asset Allocation Committee
There are three factors that tend to cause recessions—inventory misadjustments, policy errors and geopolitical events. The first in the series has become less of a factor over time. Inventory management has improved dramatically since the end of WWII, and excess inventory leading to falling output has become less of an issue. Therefore, we tend to focus on the latter two factors. Since fiscal policy changes tend to occur more slowly, monetary policy is where we spend most of our efforts. With regard to geopolitical events, we write a weekly report on that issue.
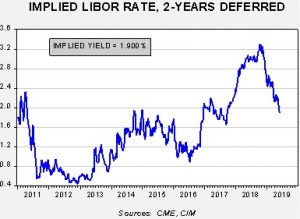
Monetary policy is facing a serious signaling problem. One of the signals we use for monetary policy is the implied LIBOR rate from the two-year deferred Eurodollar futures. That rate is an indication of what the financial markets are thinking. As we will show below, it has generally been a good indicator for when policy tightening should stop. The implied LIBOR rate has declined significantly.
Since peaking at 3.30% last October, the rate has declined to 1.90%, a drop of 140 bps.
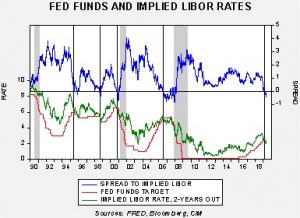
The lower lines show the implied LIBOR rate with the fed funds target. Note that the FOMC has tended to stop raising rates when the spread inverts. During the Greenspan years, easing tended to follow shortly after inversion. The Bernanke Fed did stop raising rates after inversion but didn’t ease, which may have contributed to the severity of the 2007-09 recession.
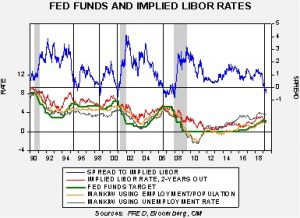
To compare how the financial market signs compare to economic signals, we have overlaid the fed funds target/deferred LIBOR rate with two of the Mankiw Rule variations, one using core CPI and the unemployment rate and the other using core CPI and the employment/population ratio. The Mankiw Rule is a simplified version of the Taylor Rule, which estimates the fed funds rate based upon core inflation and GDP relative to potential GDP. Because potential GDP isn’t directly observable, Mankiw’s original research replaced GDP with the unemployment rate. We have created our own variations as well (not shown).
The lower lines on the chart show the implied LIBOR rate, with the fed funds target and the two aforementioned estimated Mankiw Rule rates. Aside from the Mankiw Rule variation using the unemployment rate, all other variations are suggesting the Fed should be cutting rates. However, in each of the prior inversion events (shown by the vertical lines on the above chart), the estimates for the fed funds target from the Mankiw Rule variations were below the target rates.
This has been a consistent issue during this expansion; essentially, it has been difficult to determine the degree of slack in the economy. Fortunately for policymakers, this problem of estimating slack has not been a serious issue until recently. Given the current divergence in signals, the most likely outcome is for the FOMC to maintain a steady posture. The lack of a clear signal between the financial markets and the interest rate markets increases the odds of a policy mistake. Although the FOMC’s official stance is neutral, we suspect the next move will be to lower the policy rate.


