Daily Comment (January 30, 2020)
by Bill O’Grady, Thomas Wash, and Patrick Fearon-Hernandez, CFA
[Posted: 9:30 AM EST]
It’s GDP Thursday! We cover the data in detail below but the report came in at 2.0% which was close to forecast. Risk-off returns as global equity markets slump. We update the latest on the Coronavirus. The BOE surprises; the Fed does not. The EU officially accepts Brexit; the U.K. does tomorrow. We cover yesterday’s DOE data. Here are the details:
Coronavirus: We now have more than 7,711 cases confirmed along with 170 fatalities. The World Health Organization (WHO) will meet today; they may decide to declare the virus as a world public health emergency after declining to do so last week. Russia has partially closed its border with China. Some interesting research has emerged on the virus. First, the New England Journal of Medicine has calculated that the average incubation period is just over five days, not the 14 that was estimated earlier. That shorter period will likely reduce the dispersion as people get sicker sooner than thought and thus are not “out and about.” Second, the report suggests the R0 is more like 2.2 instead of the 2.5 that has been earlier estimated. That reduction means that the actual spread should be less than some earlier estimates. SARS, for example, had a R0 of 3.0, meaning that every case meant that three others were also infected. Third, the disease is primarily affecting older people; in reported cases (those sick enough to notice), over 50% were aged 60 or older, and there are very few reported cases among children of 15 years or less.
The CNY weakened and briefly breached the 7.0 CNY/USD level. The U.S. is planning another evacuation flight from China. A cruise vessel with 6,000 on board is being held in an Italian port after a guest reported flu-like symptoms. There is increasing worry about disruptions of global supply chains; if this continues to develop, it will clearly hurt global economic growth. It will certainly affect China’s growth. Mainland China markets continue to be closed, but Hong Kong is open. The Hang Seng weakened for the second day, falling 2.6%. So far, U.S. officials are treating this situation as if it won’t be a problem; however, we would expect some increase in preparedness in the coming days. Overall, our position remains the same; the virus will have a negative impact on global economic data and markets that will likely continue for another 3-4 weeks. However, we don’t anticipate a lasting effect.
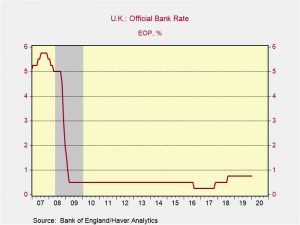
The BOE: The Bank of England held its benchmark short-term interest rate unchanged at 0.75%, as expected, based on the policymakers’ view that improved business sentiment since the December election has pushed off the need for stimulus. However, the policymakers also cut their economic forecast to the weakest since World War II. They now see the British GDP growing just 1.1% per year in the coming three years, compared with the government’s forecast of 2.8%.
U.K. equities and debt prices fell, while the GBP rallied.
The Fed: In some respects the FOMC did exactly what we expected. The changes in the statement were minimal. In fact, only three words were changed in the body of the statement and one of those referred to the month of the year. Housing spending was downgraded a bit, from “strong” to “moderate,” and inflation was changed from “near” to “returning to” the 2% target. The Fed did raise the Interest on Excess Reserves (IOER) by 5 bps, so one might be able to argue there was a modest tightening, but even this would be a stretch. However, despite the lack of change, financial markets took the response with a bearish tone. Equities fell off their highs and bonds rallied. Perhaps the moderate position on future growth dampened investor optimism.
Here is our take. First, the increase on IOER is designed to push the effective fed funds rate (the actual rate banks borrow) towards the middle of the target range.
These charts show effective fed funds and the target range. The left-hand chart shows the data from 2008 to the present, while the right-hand chart shows the data from Q4 2018. On the right-hand chart, there are two issues we want to highlight. First, the Fed has tried to keep the effective rate near the midpoint of the range; because it has been running near the low end, it is lifting the IOER to push the effective fed funds rate to the midrange. Thus, it is technically a tightening but clearly not much of one. Second, note the spike in fed funds in late Q3. That was spawned by the repo crisis.
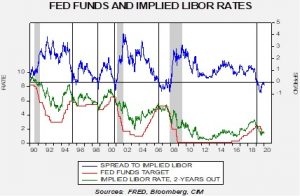
The second item of interest is that the financial markets are starting to signal further easing might be in order.
The implied LIBOR rate from the two-year deferred Eurodollar futures contract has been a good guide to policy easing. In general, when the implied rate falls below the fed funds target, easing usually follows. Last summer the spread widened out to excessive levels; the FOMC responded with rate cuts which narrowed the spread back to zero. However, in the past two weeks, the spread has widened to near 30 bps. Although the Fed will almost certainly wait, this data would suggest the next move by the central bank will be to ease. It is possible that the recent behavior of the financial markets raised hopes that the chair would have taken a more obvious dovish stance. Perhaps the lack of action is what led to the hawkish market response.
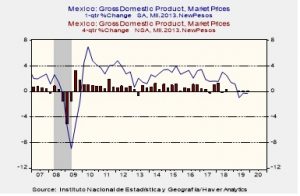
Mexico: Preliminary figures show Mexican GDP contracted by a seasonally-adjusted 0.3% in the fourth quarter of 2019. Not only was the decline worse than expected, but it also marked the third straight quarterly contraction and confirmed that the Mexican economy remains in recession. Since the three straight quarters of decline were just enough to offset a growth in the first quarter, GDP in the fourth quarter was unchanged from the same period one year earlier.
Brexit: The EU has officially accepted Brexit; the U.K. does so tomorrow. Now the focus turns to trade. The U.K. will be talking first to the EU but there is also attention being paid to the U.S. We expect Washington to be very tough on the U.K., especially in light of the Huawei (002502, CNY 2.99) decision. The EU appears to be following the lead of Westminster on this issue, which will further anger the U.S.
Odds and ends: There is an oil tanker on fire in the Persian Gulf; however, it appears to be empty and this may be a case of mutiny. According the reports, the crew has been stuck on board the vessel for more than a year due to an ownership dispute. The fire many have been set by the crew to get off the ship. Since they were evacuated, we would have to say it appears to have worked. USCMA is official. And, some good news…U.S. life expectancy has reversed a four-year decline and rose in 2019.
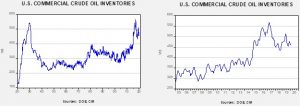
Energy update: Crude oil inventories rose 3.5 mb compared to a forecast rise to 0.1 mb.
In the details, U.S. crude oil production was unchanged at 13.0 mbpd. Exports rose 0.1 mbpd while imports rose 0.2 mbpd. The rise in stockpiles exceeded forecasts.
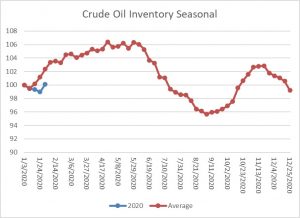
This chart shows the annual seasonal pattern for crude oil inventories. This week’s rise was consistent with seasonal patterns, although the level of inventory accumulation continues to lag historical norms. As the chart shows, oil inventories usually rise into late spring and then decline significantly into late summer. Last year, this pattern was disrupted to some extent because of exports.
The biggest surprise in the data was the sharp drop in refinery operations, which plunged 3.3% relative to expectations of a 0.7% drop.
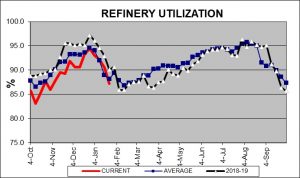
The seasonal trough usually occurs in mid-February. Refinery demand will likely remain soft until early May, which is a bearish factor for oil prices.
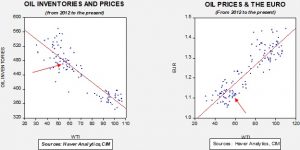
Based on our oil inventory/price model, fair value is $63.37; using the euro/price model, fair value is $50.47. The combined model, a broader analysis of the oil price, generates a fair value of $54.41. We are seeing a steady fall in all of the fair value calculations, as the dollar strengthens and oil inventories rise. However, the combined model is now in line with current prices so we may see some consolidation in the coming weeks.


