Business Cycle Report (May 28, 2020)
by Thomas Wash
The business cycle has a major impact on financial markets; recessions usually accompany bear markets in equities. The intention of this report is to keep our readers apprised of the potential for recession, updated on a monthly basis. Although it isn’t the final word on our views about recession, it is part of our process in signaling the potential for a downturn.
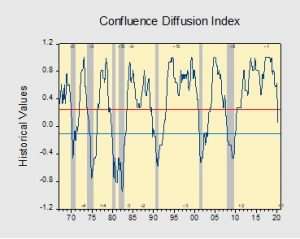
In April, the diffusion index fell into recession territory for the first time since the financial crisis. Last month, the nationwide shutdown led to the sharpest decline in employment payrolls in the country’s history, while initial claims remain elevated at all-time highs. The financial markets showed some signs of revival as equities rallied the most in history in a month and bond prices rose due to heightened demand for U.S. Treasuries as investors flocked to safety while lockdown orders remained in place globally. Additionally, manufacturing production in certain industries has continued, in spite of the shutdown, to address supply shortages. However, the pandemic continued to weigh heavily on both investor and consumer confidence as there are growing concerns that the impact could continue even after the economy reopens. As a result, seven out of the 11 indicators are in contraction territory. The reading for April fell to +0.030 from +0.393 the previous month, below the recession signal of +0.250.
The chart above shows the Confluence Diffusion Index. It uses a three-month moving average of 11 leading indicators to track the state of the business cycle. The red line signals when the business cycle is headed toward a contraction, while the blue line signals when the business cycle is headed toward a recovery. On average, the diffusion index is currently providing about six months of lead time for a contraction and five months of lead time for a recovery. Continue reading for a more in-depth understanding of how the indicators are performing and refer to our Glossary of Charts at the back of this report for a description of each chart and what it measures. A chart title listed in red indicates that indicator is signaling recession.


