Asset Allocation Weekly (May 29, 2020)
by Asset Allocation Committee
The recent strong rally in equities has befuddled investors—how can equities rally with such vigor when the economy is historically weak? We suspect there are two reasons for this recovery:
- Although the drop in economic activity is deep, it will likely be short.
- Supportive monetary policy is a powerful elixir for equities.
Equity markets are forward-looking; investors put their money to work on expectations of future economic conditions and earnings, not based on what is occurring today. The current downturn is historic. The decline in the economy has been very fast and deep, but it will likely be short. In fact, the recovery should begin by midsummer at the latest. We use these words to mean something specific.
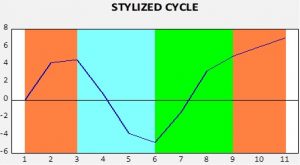
This chart shows a stylized path of the business cycle. Orange represents expansion, when the economy is making new peaks in an indicator. This can be GDP, industrial production, coincident indicators, etc. Blue is recession and is measured from peak to trough. Green is recovery, which lasts from trough until a new peak occurs. Finally, once a new peak is made, a new expansion is underway.
We expect this recession to end quickly because the trough will probably occur in Q2. However, the recovery will be long and likely dictated by the path of the virus. We currently estimate the new expansion will start in H2 2021.

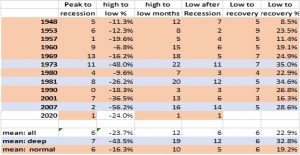
This table shows the declines in the S&P 500 for the postwar recessions. On average, equities tend to peak about six months before the onset of the economic downturn, while the low occurs about six months after the peak in economic activity. From the market low to recovery, the S&P 500 usually rebounds by about 20%. But, notice from deep recessions that the rebound from the low is about 33%. The rebound we have witnessed thus far is in line with a deep downturn, but it appears unusual due to the compressed nature of the current recession.
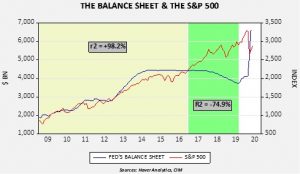
Also noted above are the aggressive actions taken by the FOMC. Below is a chart that will be familiar to regular readers.
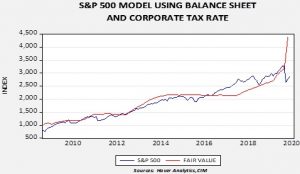
From early 2009 until November 2016, the path of the S&P 500 closely matched the Fed’s balance sheet. There was always concern that the relation was a spurious correlation, and the behavior from December 2016 into August 2019 suggested it was. However, it is important to note that equities were buoyed by expectations of a massive corporate tax cut. Taking the balance sheet and incorporating the tax cut gives us a model that offers some insight into the impact of current monetary policy.
Fair value is derived from smoothing the higher marginal rate of the corporate tax and the balance sheet. Adding the impact of the tax cut accounts for some of the rally in equities. The sharp rise in the fair value in recent months reflects the massive expansion of the balance sheet.
This is not our forecast for the S&P 500, but it does offer some insight into how powerful the Fed’s actions have been. We doubt the equity index will track this model due to the level of uncertainty surrounding the path of the economy. Nevertheless, a projected short, sharp downturn coupled with the most rapid increase in the balance sheet since WWII have created strong support for equities that will likely prevent significant corrections, barring a major policy error or an unexpected negative turn in the toxicity of the virus.


