Asset Allocation Weekly (March 26, 2021)
by Asset Allocation Committee | PDF
(Note: Due to the upcoming Good Friday holiday, the next report will be published on April 9.)
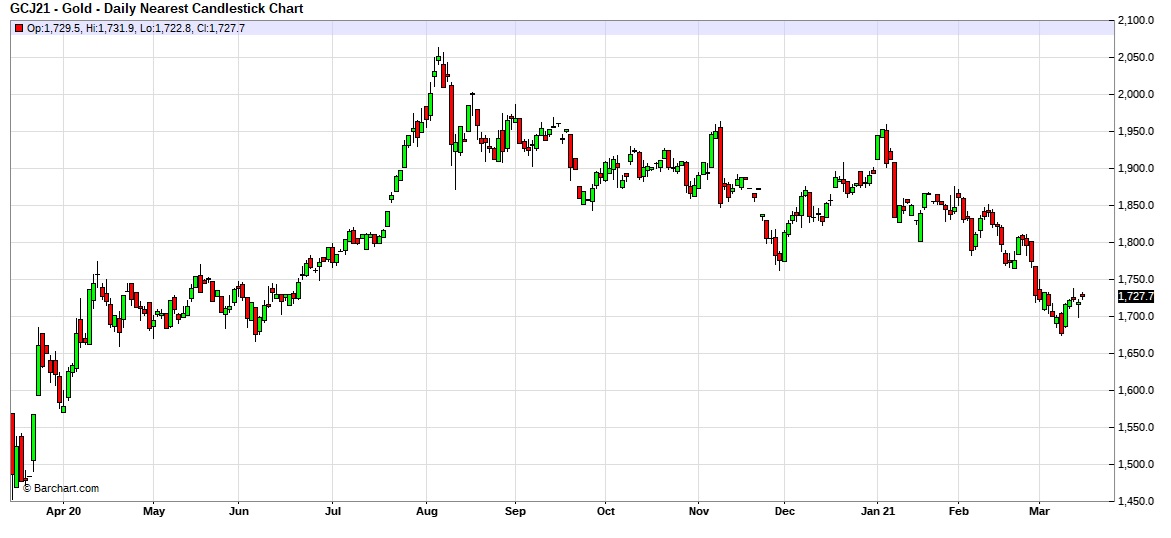
Since peaking in August, gold prices have been under pressure.

Technically, prices broke support around 1750 in early March and have been attempting to consolidate.
We have been holding gold in our asset allocation portfolios since 2018, although the level was reduced in the most recent rebalance to add a position in broader commodities. As the price languishes, how should investors view gold? What is the outlook?
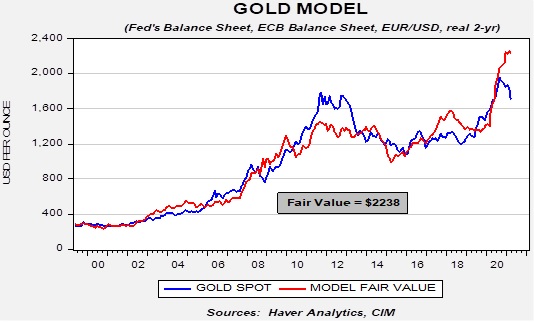
The long-term outlook for gold remains positive. Our basic gold model, which uses the balance sheets of the Federal Reserve and the European Central Bank, the EUR/USD exchange rate, and real two-year T-note yields, suggests that prices are significantly undervalued.
On the other hand, there are several short-term factors that are weighing on prices. The most important is rising long-duration Treasury yields.
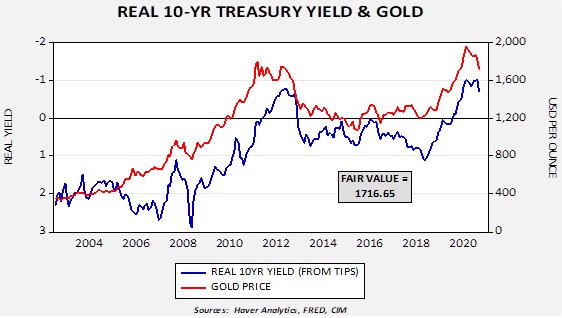
This chart shows the real 10-year yield derived from the TIPS spread against Treasuries. The real yield is inverted on the chart scale. Note that recently the real yield began to rise (become less negative). Regressing the relationship generates a fair value of 1716.65, which is around where gold is trading now. In addition, we have seen gold flows into exchange-traded products wane recently, adding additional pressure.
If the FOMC is serious about boosting employment, monetary policy should remain accommodative; the problem for policymakers is that a steepening yield curve will tend to lift long-term interest rates further. If the Fed allows the 10-year T-note to “find its natural level,” then we would expect rates to reach 1.90% to 2.00%. That likely means additional short-term pressure on gold prices. At some point, we do expect the FOMC to take steps to halt the rise in long-term Treasury rates which will likely lift gold prices. But, until that happens, gold will likely struggle to rally.


