Daily Comment (June 9, 2016)
by Bill O’Grady and Kaisa Stucke
[Posted: 9:30 AM EDT] Signs of a growing rebellion against negative interest rate policies (NIRP) were evident this morning. The front page story in today’s FT is “Negative Rates Stir Mutiny with Bank Threats to put Cash in Vaults.” The report indicates that major banks in Europe and Japan are pushing back against NIRP. Commerzbank (CRZBY, $8.31) is considering a plan to hold cash in vaults rather than pay a negative rate to the ECB. With the phasing out of the €500 note, this process would be more difficult, but the threat does show the limits of NIRP. The Bank of Tokyo-Mitsubishi UFJ, part of the Mitsubishi UFJ Financial Group (MTU, $5.01), is deliberating a plan to relinquish its primary dealer role for JGB. If the bank leaves, it will be the first in Japan to walk away from this position. For the most part, the move by Mitsubishi is symbolic; the BOJ is buying up most of the government’s new issuance of JGB anyway. However, the action is a very public display of displeasure with BOJ policy.
NIRP acts as a tax on excess liquidity. The idea is that by implementing negative rates, banks will be spurred to lend. However, if the problem of excess reserves is due to the lack of loan demand, and not to the reluctance of bankers to lend, NIRP simply acts to reduce bank profitability. Textbook economics suggests that a zero-bound exists; once interest rates turn negative, there is a nominal positive return from cash and the financial system will simply suffer disintermediation, meaning that households and businesses will simply hold cash.
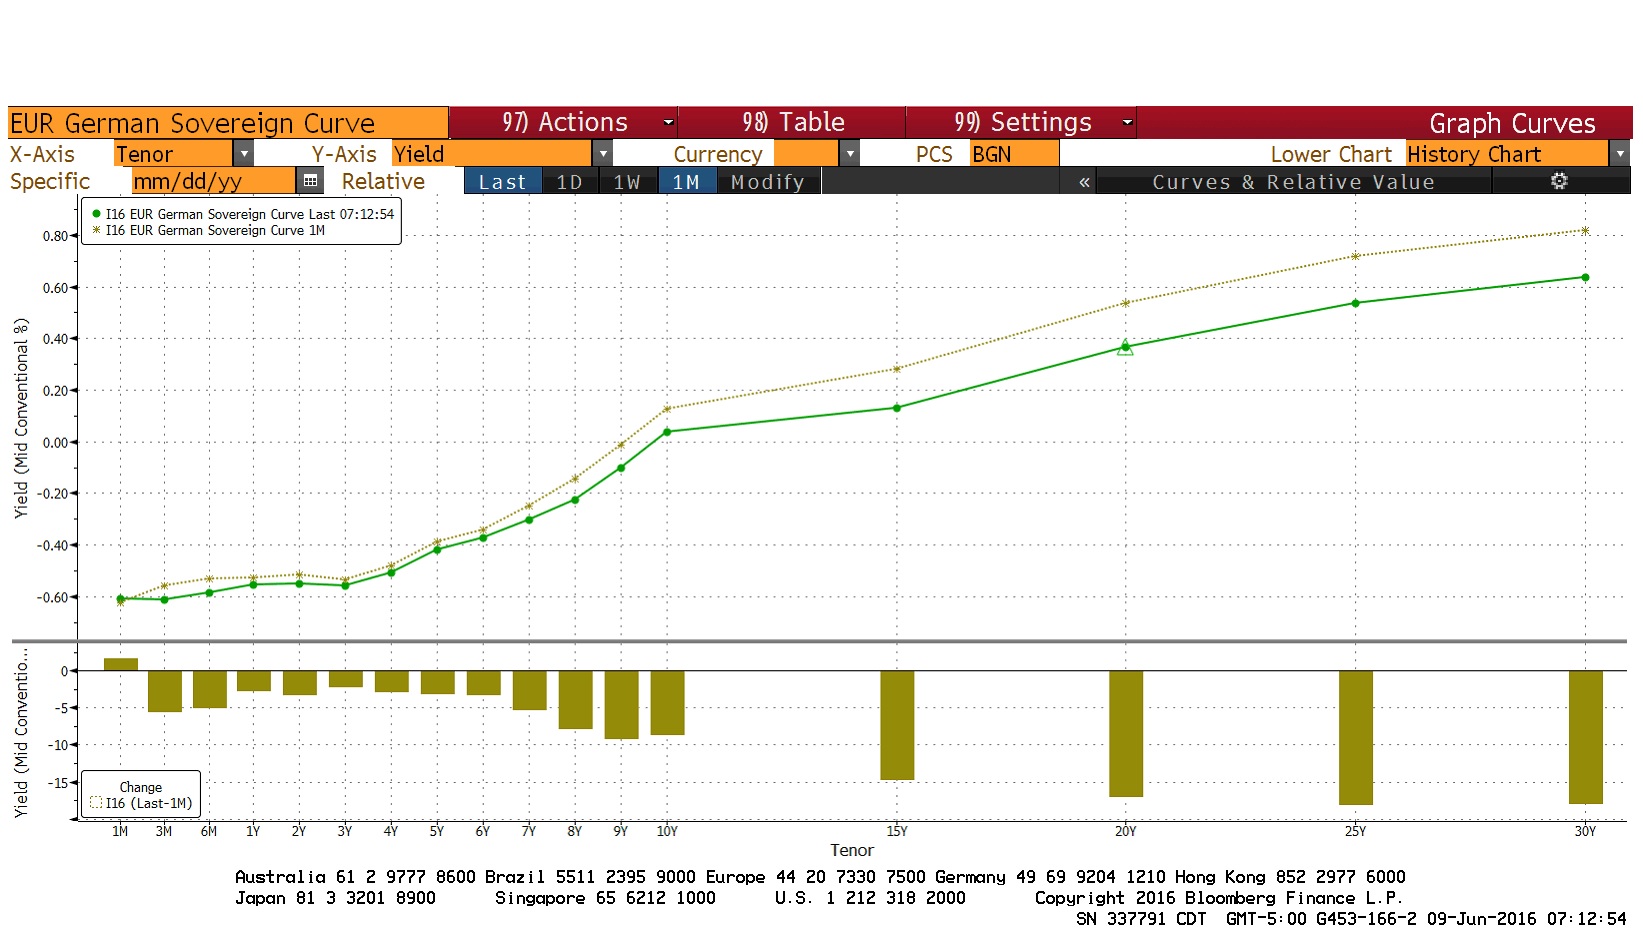
That isn’t what we are actually seeing at present. It is estimated that $10.4 trillion of sovereign debt around the world is now carrying a negative yield. German sovereign yields are negative to almost a decade and it is expected that we could see a negative yield on the Bund soon.
This chart shows the German sovereign yield curve for today and a month ago. The German 10-year yield is currently at 4 bps and yields up to nearly a 10-year term are anchored below zero. The combination of flight to safety, the lack of bonds for the ECB to conduct QE and the lack of an alternative are leading to negative rates. Falling overseas yields have pushed longer duration Treasury rates lower in sympathy.
Finally, on the topic of central banks, the Bank of Korea surprised global financial markets with an unexpected 25 bps cut to 1.25% for its base lending rate. The unanimous decision was based on slowing export growth, weak domestic growth and corporate restructuring.
In the aftermath of last Friday’s employment report, the JOLTS numbers, released yesterday at 10:00 EDT, became more closely watched than usual. This isn’t to say this report isn’t considered important, but it has a limited history (it started in 2000) and there are a lot of numbers in the report that can be difficult to interpret. The headline number showed job openings were higher than expected, coming in at 5.788 mm, up 118k from March, and above the survey level of 5.675 mm. On the other hand, hires came in at 5.092 mm, down 198k.
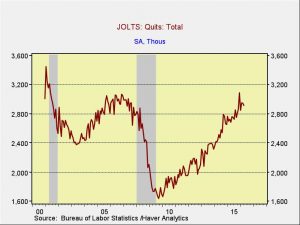
Quit rates, which tend to show increasing worker confidence, held at pre-recession levels.
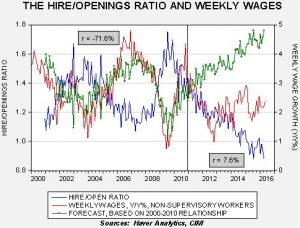
The relationship that caught our interest was between the hire/openings ratio and weekly wage growth.
This chart shows the ratio of hires to job openings. The ratio is very low, which means that there are many more openings than hires. In the 2000-10 period, the relationship between the yearly change in wage growth for non-supervisory workers was fairly tight, at -71.6%. However, from 2011 to the present, the relationship has become virtually uncorrelated (and the sign reversed). The green line on the chart shows the forecast from a regression where we use the hire/openings ratio to explain wage growth, based on the 2000-10 period. If the relationship between these two variables had been maintained, wage growth would be approaching 5% instead of the 2.4% rise we are currently experiencing.
This divergence is a reflection of the changes we have seen in the labor market; the low level of the employment/population ratio and the participation rate coincide with this chart. This chart does explain the fears of the FOMC; the members appear worried that, at some point, wage growth will “catch up” due to the tight labor markets. If, on the other hand, the labor markets have permanently changed and we are not going back to the pre-2010 situation, wage growth will remain stagnant even with a plethora of job openings compared to hires. And that will mean that inflation should remain under control and the need to raise rates will be less.
The U.S. crude oil inventories fell mostly in line with expectations; stockpiles fell 3.2 mb to 532.5 mb compared to estimates of a 3.3 mb decline.
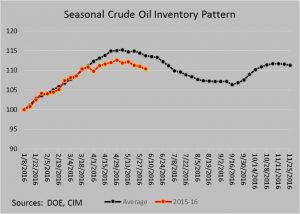
This chart shows current crude oil inventories, both over the long-term and the last decade. We are starting to see inventories decline but normal levels would be below 400 mb, some 130 mb lower than now.
So, obviously, inventories remain elevated. But, inventories are lagging the usual seasonal pattern and we are clearly on a declining path. We are running about a month ahead of the normal seasonal decline.
It is important to remember that the dollar is playing a bigger role in determining oil prices.
Based on inventories alone, oil prices are profoundly overvalued with the fair value price of $31.01. Meanwhile, the EUR/WTI model generates a fair value of $49.67, close to current values. Together (which is a more sound methodology), fair value is $42.25, meaning that current prices are a bit rich. For those interested in oil, the Fed is arguably more important than the DOE inventories for the future of oil prices, and the recent weak employment data was a bullish event for oil prices in that it put bearish pressure on the dollar. The market is putting the odds of a July rate hike at 18%; if the employment data for June show that the May data was an anomaly, it could be bearish for oil prices.


