Asset Allocation Weekly (June 10, 2016)
by Asset Allocation Committee
In our asset allocation process, we focus on cyclical trends—trends that tend to have three- to five-year time horizons. Two examples of these sorts of trends are the business cycle and the monetary policy cycle. Although both cycles can last longer or less than three to five years, in general, these types of trends have an impact on market activity and distinguish our process from strategic models, which tend to focus on very long-term cycles. We believe that ignoring the cyclical trends can lead to short- to medium-term losses that can be avoided by taking shorter term factors into account.
However, this does not mean that longer term cycles are not important. We view these longer term cycles as the overall market environment. These factors include the geopolitical environment (especially related to the U.S. superpower role), inflation policy (which tends to last decades), debt cycles (which also have a long life span), and secular economic growth cycles (which tend to be affected by productivity, technology, demographics and debt). Although the inflection points in these long-term cycles tend to occur infrequently, perhaps once or twice in a lifetime, they have significant effects on short-term cycles when they do occur.
We continue to monitor the long-term economic growth cycle.
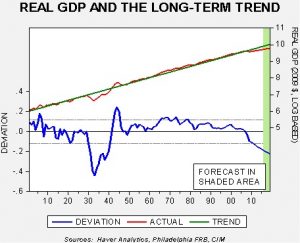
This chart shows GDP from 1901 and includes consensus forecasts for 2016 through 2019, using the Philadelphia FRB Survey of Professional Forecasters. The key line is on the lower end of the chart showing the deviation from trend. There are two periods that show a sharp negative deviation from trend, the Great Depression and the Great Recession. In the Great Depression, the economy fell sharply but staged a strong recovery into the war years, with the exception of a pullback during the 1937 recession. In the current downturn, the decline is much shallower, but, assuming the consensus forecast is correct, there is no strong recovery in the offing. In other words, it is quite possible we have exchanged a deep, but shorter, economic decline for one that is shallower but interminable.
Here is another way of looking at the data.
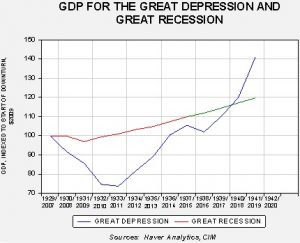
On this chart, we have indexed the level of real GDP beginning in 1929 and 2007. In the Great Depression (shown as the blue line), GDP dropped by nearly 25% at the trough; in the Great Recession, the decline was a little over 3% (with the actual data shown in red, and the forecast in green). However, the recovery from the Great Depression was quite strong, exceeding the previous peak by 1936 and, had the Roosevelt administration not derailed the improvement through an ill-advised fiscal tightening in 1937, the economy would have likely gathered even more momentum. Meanwhile, if the Philadelphia FRB Survey of Professional Forecasters is accurate, by 2018, the recovery from the Great Depression will exceed the current cycle. Of course, mobilization for WWII partly explains the expansion. But, what it probably also shows is that if the current economy is ever going to recover to trend, it will likely take a large fiscal shock, such as a major war, to bring that about.
In the current environment, we don’t expect a major fiscal expansion to occur, although we note that given the populist tone of the current election cycle, deficit reduction doesn’t appear to be a major political factor. Still, as the second chart shows, we are rapidly approaching the point where the current period of weak growth will extend past the period of the Great Depression. In our asset allocation process, we have assumed that growth will remain lackluster, meaning that interest rates and inflation would stay low. We continue to closely monitor the economic and political environment for evidence that subpar growth will be addressed by more radical measures. But, thus far, there isn’t much evidence to suggest that significant change is in the offing. Therefore, until we see signs of a change in the policy environment, we expect the current cyclical and secular trends to remain in place.


