Asset Allocation Weekly (October 21, 2016)
by Asset Allocation Committee
The dollar has been strengthening over the past few weeks; we believe much of this appreciation is due to expectations of tighter monetary policy. Fed funds futures suggest that there is a 60+% chance of a rate hike at the December FOMC meeting. Although the FOMC is divided and there are prominent doves that oppose any tightening, the consensus on the committee seems to be leaning toward a 25 bps increase. However, we also suspect that the next hike (following December) will be delayed for several months. In other words, to placate the doves on the FOMC, Chair Yellen will need to promise a very slow path; to satisfy the hawks, she will need to raise rates in December.
There are at least four different ways to value currencies—relative inflation, relative interest rates, trade performance and relative productivity. As a general rule, if any of the four performed consistently, the other three wouldn’t exist. Of the four, relative inflation, so-called “purchasing power parity,” is the oldest. Although most of the time it doesn’t give strong signals, it does tend to indicate when a currency pair is at an extreme.
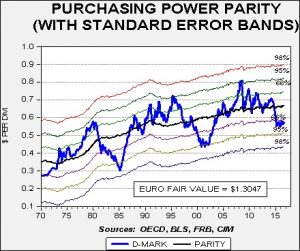
This chart shows the purchasing power parity relationship between the dollar and the D-mark. We use the legacy German currency and calculate its currency value based on its conversion rate at the time the euro was introduced. We do this for two reasons; first, we have a consistent inflation history with Germany, and second, Germany is the dominant economy in the Eurozone, meaning the comparison with Germany is likely representative for the leading nations in the Eurozone. In our opinion, parity models are only useful at extremes. When the relationship becomes more than one standard error from parity, it tends to signal a problem with valuation. Currently, the dollar is overvalued by more than one standard error. There have only been two other periods when the dollar was stronger based on this measure. And, we note that this degree of overvaluation has been in place since January 2015, indicating it has been overvalued for a rather long time.
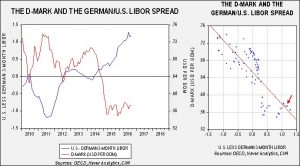
It appears that this deviation from fair value is due to divergent monetary policy. The spread between German and U.S. three-month LIBOR rates has widened in favor of the U.S.
These charts show the same data in two forms, a simple line graph and a scatter plot. In 2014, as the markets began to discount future FOMC tightening, the LIBOR rate began to rise modestly. At the same time, German rates fell sharply as the ECB tried to address deflation and weak economic growth; in fact, German three-month LIBOR remains in negative territory.
Although interest rate differentials are favoring the U.S., it is interesting to note that the explanatory power of interest rate differentials in the purchasing power parity model is modest at best. In other words, in relation to the past 36 years, the current spread in interest rates should not be having this degree of impact. The current spread is having an expanded impact mostly due to the current level of low rates.[1]
Complicating matters is that the U.S. three-month LIBOR rate has been rising due to changes in U.S. money market regulation. There has been a sustained exodus of liquidity out of institutional prime money market funds and this has led to higher three-month LIBOR rates. We doubt this level of LIBOR will be sustained over time, and so the U.S. side of the interest rate spread should ease. In addition, German LIBOR rates have been negative for the past few months. We doubt the ECB will maintain negative rates much longer and instead use QE for monetary stimulus. Thus, we would expect the spread to narrow in the coming weeks.
In addition, there has been a marked change in market expectations toward FOMC monetary policy.
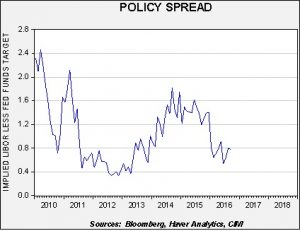
This chart shows the spread between the fed funds target and the two-year deferred Eurodollar futures contract. The latter shows the market’s projection for future three-month LIBOR rates. For much of the past two years, Eurodollar futures were projecting a terminal rate for fed funds of 1.50%; that has now declined to around 75 bps. Simply put, the financial markets expect perhaps one or two more rate hikes over the next two years. If this is all we get, we would expect the rate differentials between Germany and the U.S. to steadily contract.
It is worth noting that the current strength of the dollar appears based on the policy spread in 2014-15. If so, once the market adjusts to a lower terminal fed funds target, we would expect some dollar weakness to develop. In the second half of next year, a USD/EUR of 1.25 (a USD/DMK of 0.6410) would be likely. A weaker dollar would be supportive for equities and commodities and bearish for debt and foreign equity markets, although this weakness would be partially offset by stronger foreign currencies. In addition, emerging equities usually strengthen relative to developed markets when the dollar weakens. Thus, in our asset allocation models, we have been slowly adding commodities and emerging equities to portfolios. If the dollar weakens in 2017, we would likely build on these initial positions.
______________________
[1] Since 1970, the average spread between the U.S. and Germany is 69 bps, suggesting the current spread of 119 bps is rather wide. However the standard deviation is 235 bps, meaning the current spread is within the normal range.


