Asset Allocation Weekly (May 12, 2017)
by Asset Allocation Committee
Slow economic growth has plagued the West. Although the concern has been acute since the Great Financial Crisis (GFC), worries about slowing growth predated that event. Perhaps the most important factor contributing to sluggish growth has been tepid productivity growth.
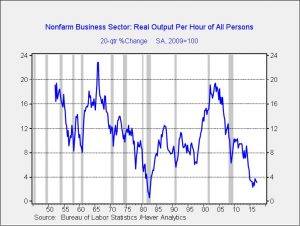
This chart shows the five-year change in productivity; we use this longer term rate of change to more clearly show the trend in productivity growth. As the chart indicates, productivity growth is remarkably weak; in fact, in the postwar era, only the weakness seen in the depths of the 1981-82 recession recorded lower productivity growth by this measure.
Economic theory holds that production comes from the combination of land, labor, capital and entrepreneurship. Most models focus on capital and labor. The Cobb-Douglas production function[1] is a canonical expression of how economists think about forecasting output. Production is the combination of capital and labor, scaled by productivity. If productivity is constant, growth comes by adding capital (investment in plant and equipment, etc.) and workers (or, specifically, hours worked). If an economy increases its productivity, more output is gained for each additional unit of labor and capital. That’s why falling productivity is such a problem; it means that additional labor and capital resources must be deployed just to keep production steady.
Productivity is something of the holy grail of economics. Theories of what boosts productivity abound; deregulation and competition are thought to increase it, supporting entrepreneurship with low taxes could be a factor, education and immigration could support increases and, of course, technological progress is a necessary ingredient. However, no economist has yet been able to definitively say what causes productivity to universally rise under all conditions.
However, we can say that an economy with weak productivity growth will struggle. Capital and labor essentially divide total output and low productivity makes that division difficult. On the other hand, rising productivity can allow both capital and labor to enjoy a rising absolute share of output. Social peace is much easier to achieve with rising productivity. It is probably no accident that the rise of populism in the West has coincided with weak productivity growth.
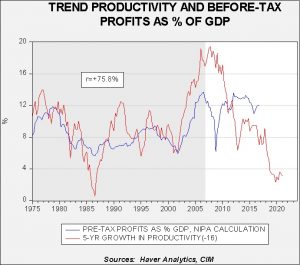
From the mid-1970s into the GFC, the relationship between corporate profits and the five-year growth rate of productivity was fairly consistent.
This chart shows pre-tax corporate profits, on a national income product accounts basis, as a percentage of GDP along with the five-year growth rate of productivity. From the mid-1970s into 2007, the two series were highly correlated at 75.8%, with trend productivity leading profits by four years. Since 2007, the two are inversely correlated at the 53.3% level. Clearly, profits have remained elevated despite weak trend productivity, which begs the question—how did profits hold up in the face of falling productivity?
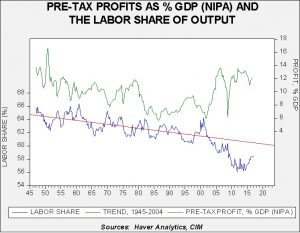
What has occurred is that relative labor compensation has fallen.
The upper line on this chart shows pre-tax profits as a percentage of GDP. The lower line shows labor’s share of output along with a time trend calculated from 1947 to 2004. From 1947 through 2004, the share held fairly steady; although there was a clear downtrend, the slope was fairly benign. Clearly after 2004 the share fell well below trend, and the labor share plummeted after the GFC. It has recovered some of its losses since 2015 but the data is still well below trend. A falling share to labor has allowed firms to overcome weak productivity trends and retain high margins.
Why has labor’s share of output declined? The media discusses a litany of reasons…technology and globalization have given firms market power over labor and allowed companies to keep wages contained despite tightening labor markets. Although this condition has been a boon for profit margins, it has been difficult for workers and we suspect the rise of populism is a direct result of wage pressures.
As the first chart shows, because of the lagged effect of trend productivity, the effects of weak productivity will become acute starting around mid-2018. Without a decline in the labor share of output, profit margins will come under growing pressure. Using a simple regression of trend productivity and labor share, to maintain pre-tax profits of 12% would require the labor share to fall to 55% by the end of 2018. If the labor share remains constant, profit margins will decline to 9.6% of GDP. This level is still historically high but, given market expectations of continued strong profit margins, even this decline will be problematic.
The Trump administration continues to straddle the line between a traditional GOP stance that favors business and capital and a populist variant that calls for trade protection and immigration restrictions. If President Trump decides to favor his working class supporters, which would likely boost the labor share, profit margins would come under even more pressure. This is a factor we will be monitoring closely as the year progresses.
_______________________________
[1] P(L, K) = bLαKβ, where: • P = total production (the monetary value of all goods produced in a year) • L = labor input (the total number of person-hours worked in a year) • K = capital input (the monetary worth of all machinery, equipment and buildings) • b = total factor productivity • α and β are the output elasticities of labor and capital, respectively. These values are constants determined by available technology.


