Daily Comment (June 2, 2017)
by Bill O’Grady, Kaisa Stucke, and Thomas Wash
[Posted: 9:30 AM EDT] The employment data, discussed at length below, was disappointing, with payrolls coming in weak. The bullish headline was that the unemployment rate fell to a new cycle low; in fact, a 16-year low. Sadly, that occurred because the labor force fell by a whopping 429k, offsetting a 233k decline in employment.
The president did remove the U.S. from the Paris Accord. There is much commentary on this issue. Our read is that the accord is mostly for show; there is no enforcement mechanism beyond international shaming and the goals are self-set. Anytime an agreement can have nearly all the nations of the world join is one that either (a) isn’t going to change very much, or (b) is being enforced by the economic and military power of the hegemon. The Paris Accord falls under the first type.
However, the signaling is important. The U.S. is forgoing any element of leadership on climate change as the president makes it abundantly clear that his mantra of “America First” is, and remains, the key element of his administration. There is much punditry suggesting that this hands global leadership to China. If only…instead, this is further evidence that we are skidding rapidly to a “G-Zero” world in which there is no global leadership. Could China use this issue to expand its global influence? Perhaps. But the litmus test would be whether China is willing to cut its growth to 3% in order to take leadership on climate change. We strongly suspect that scenario isn’t likely.
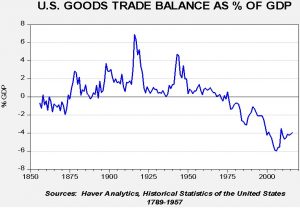
This is what global leadership looks like:
This chart shows the U.S. goods trade balance as a percentage of GDP, starting in 1860. Note that from the 1870s until the 1970s, the U.S. tended to run trade surpluses. But, as part of our superpower role, we have to provide dollars to the world for global trade, meaning that we will be required to expand our trade deficit in order to provide global liquidity. In the last decade, we ran a goods-trade deficit that reached 6% of GDP. This was done to accommodate China’s development. Is there any other nation in the world willing to make such sacrifices for global growth? Is there any other nation willing to suffer the destruction of industries to global competition that is structured to generate trade surpluses at America’s expense? Is China prepared to take similar actions to reduce carbon emissions?
For the foreseeable future, there is no obvious replacement to U.S. leadership. That’s why Trump’s decision is so unsettling. In reality, we expect businesses, along with state and local governments, to continue to take steps to reduce carbon emissions. As we noted yesterday, insurance companies and investors are demanding such changes from business. In addition, the chances of policy reversal in the next administration is likely. The key change here, as we noted above, is the signal that the U.S. is reducing its global responsibilities. For our regular readers, this comment isn’t a shock; this is a theme we have been highlighting for years. But it is possible that historians years from now will cite this event as a bright line that signals the change in American policy. Just like the U.S. decision not to join the League of Nations, America is letting the rest of the world know that they will need to find their own way.
U.S. crude oil inventories fell 6.4 mb compared to market expectations of a 3.0 mb draw.
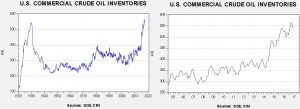
This chart shows current crude oil inventories, both over the long term and the last decade. We have added the estimated level of lease stocks to maintain the consistency of the data. As the chart shows, inventories remain historically high but they are declining. We also note that, as part of an Obama era agreement, there was a 1.0 mb sale of oil out of the Strategic Petroleum Reserve. This is part of a $375.4 mm sale (or 8.0 mb) done, in part, to pay for modernization of the SPR facilities. International agreements require that OECD nations hold 90 days of imports in storage. Due to falling imports, the current coverage is near 140 days. Taking that into account, the draw would have been 7.4 mb, which is a larger draw than forecast.
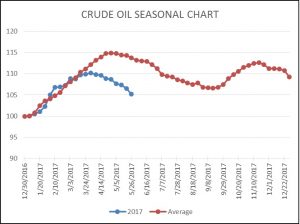
As the seasonal chart below shows, inventories are usually well into the seasonal withdrawal period. This year, that process began early. Although the actual level of stockpiles remains quite high, we are seeing stock declines at a rather rapid pace. Assuming a similar drop from this year’s peak of 566.5 mb at the end of March, we will end up at 505 mb by late September. In fact, the current level of inventories has already declined more than the seasonal trough, which is supportive.

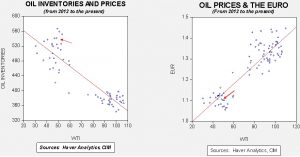
Based on inventories alone, oil prices are overvalued with the fair value price of $37.69. Meanwhile, the EUR/WTI model generates a fair value of $48.80. Together (which is a more sound methodology), fair value is $45.14, meaning that current prices are above fair value but the deviation has been steadily closing in recent weeks. Using this model and assuming a steady €/$ exchange rate and a 505 mb trough in oil inventories, fair value for oil would be $47.25. Overall oil market sentiment has become rather bearish as a number of wirehouses have cut their price forecasts. Thus, a test of the lower end of the trading range, around $45, would not be a great surprise. However, we are seeing solid inventory liquidation and, if the dollar weakens, a recovery from these lower levels may be in the offing.


