Asset Allocation Weekly (July 21, 2017)
by Asset Allocation Committee
In the past few years, we have generally avoided allocations to non-U.S. markets for our asset allocation portfolios due to two primary concerns. First, the dollar was rising as a result of an improving U.S. economy and policy divergences between the U.S. and the rest of the world. The Federal Reserve was raising rates and tapering its balance sheet while the majority of the other nations were still adding monetary stimulus. Second, we have had secular concerns about the stability and attractiveness of foreign investing in a world where the U.S. is seemingly reducing its hegemonic role.
This quarter we have added foreign allocations into our portfolios. The primary reason is that we believe the dollar’s bull market is probably coming to a close. On a relative valuation basis, the dollar has become rather expensive.
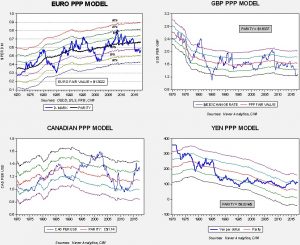
This chart shows four purchasing power parity models for the euro, yen, British pound and Canadian dollar. In all four cases, the dollar is trading “rich” by more than one standard error, and in two cases, nearly two standard errors from parity. Purchasing power parity uses relative inflation to value currencies. As the models show, currencies are rarely at parity. Although purchasing power parity is the oldest way to value currencies, it isn’t the most accurate. However, it tends to be useful at extremes, and exchange rates tend to move around the parity measure. In other words, parity is something of an anchor around which the actual exchange rate vacillates.
History also suggests that exchange rates can diverge from parity for long periods of time, which usually means that a catalyst is required to move currencies from extremes of under-and over-valuation. For example, in the above euro and pound models, the deep undervaluation in the mid-1980s ended with the Plaza Accord. Yen overvaluation in the early 1990s was ended by the Halifax Accord. Changes in policy or governments can trigger an end to valuation extremes as well.
This leads us to two additional reasons for this repositioning. We believe there are two catalysts which will pressure the dollar in the coming quarters. First, the Federal Reserve appears to be hedging on future tightening. Although the dots charts still indicate rising rates, a number of FOMC members have raised worries about raising rates while inflation remains depressed. Chair Yellen appears to be offering a trade to the hawks on the committee; instead of raising rates, balance sheet reductions can act as policy tightening. It is possible reducing the balance sheet will be dollar bullish. However, that isn’t supported by the data.
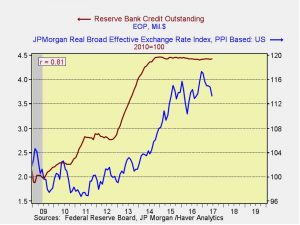
Although economic theory would suggest that boosting the size of the balance sheet should depreciate a currency, all else held equal, the pattern on the above chart developed likely because QE raised hopes of stronger growth. Our expectation is that reducing the balance sheet probably won’t matter, but if the pattern is consistent, balance sheet reduction may actually be dollar-bearish. So, we expect the anticipated monetary policy trade of fewer rate hikes for balance sheet shrinkage to be bearish for the dollar.
The second catalyst is policy disappointment from the Trump administration. Earlier this year, we were worried about the dollar’s overvaluation. And, proposed tax cuts and fiscal expansion from the Trump administration would have been dollar bullish, even at lofty valuations. However, the likelihood of major policy actions have declined and each month that passes without a policy adjustment means that political capital is being lost and it becomes less likely anything will pass. As disappointment grows, we would expect the dollar to retreat.
Although we retain our secular concerns about the stability and attractiveness of foreign investing in a world where the U.S. is seemingly reducing its hegemonic role, these concerns are overshadowed by the changing dynamics of monetary stimulus. Essentially, the near-term effects of policy and the exchange rate outweigh our secular concerns.
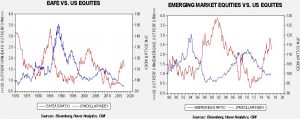
Finally, the issue of recent performance needs to be addressed. Both emerging and foreign developed equity markets have performed very well this year and there is a concern that we may be shifting too late into these asset classes. Although possible, if our expectations of a weaker dollar are accurate, history would suggest a longer period of foreign outperformance.
The red line on both charts shows the JP Morgan real dollar index. The blue line on the left chart is the ratio of dollar-denominated EAFE and the S&P; on the right chart, it’s the dollar-denominated ratio of emerging markets and the S&P. Both have been rebased to their respective start periods. On both charts, a lower ratio indicates U.S. equity outperformance relative to foreign markets; a rising ratio shows the opposite. In both cases, periods of dollar strength coincide with domestic outperformance. Thus, even with good foreign performance this year, a weaker dollar may result in a longer period of foreign outperformance.


