Asset Allocation Weekly (December 8, 2017)
by Asset Allocation Committee
We have received a number of requests to update our S&P 500/Fed balance sheet model.
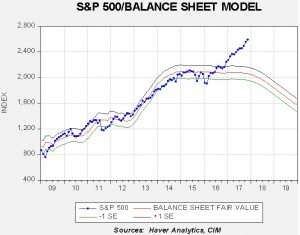
This chart shows the results from our S&P 500/Fed balance sheet model. We have projected the model’s forecast using the expected path of balance sheet reduction. It shows that the equity index tended to follow monetary policy from the end of the recession in mid-2009 until the election of President Trump. Since the election, the index has far outperformed what the balance sheet model projects for fair value.
This model was always problematic, potentially a classic example of data mining. The problem of data mining and the current discussion of “big data” get at the philosophical problem of “how do we know?”[1] Our basic procedure when looking at correlations is to try to formulate a theoretical reason for why the correlation should exist. Simply finding correlations, otherwise called data mining, is fraught with risk. Some correlations are spurious—they develop almost by accident and fade over time. Others are true as far as they go but can lead one to draw inappropriate conclusions.

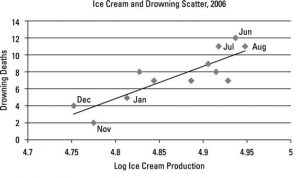
This chart shows the relationship between ice cream consumption and drowning in 2006. The relationship of these two variables is a common pedagogical tool when teaching statistics. It is clear that a relationship exists between these two variables. However, they share a common factor that is the likely cause of the correlation—summer! If a policymaker neglected to take the seasonal factor into account, a case could be made for a tax on ice cream in a bid to reduce drownings. It is almost certain such a policy would fail.
We have concluded that the most likely reason the Fed’s balance sheet was related to the S&P 500 was because it showed that the U.S. central bank still had effective tools to stimulate economic growth. In other words, QE was mostly a confidence builder. It appears that Trump’s promises of deregulation and tax cuts have replaced QE in supporting investor confidence and thus, the relationship has broken down between the Federal Reserve’s balance sheet and the S&P 500.
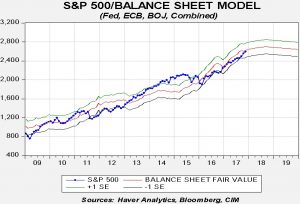
However, we would be remiss if we didn’t examine another element of the balance sheet relationship. With globalized financial markets, it is also possible that the behavior of foreign central banks affects U.S. equities as well. Combining the exchange rate-adjusted balance sheets of the European Central Bank (ECB), the Bank of Japan (BOJ) and the Federal Reserve, with projections based on policy guidance, yields the following model.
The BOJ’s balance sheet path is more difficult to project because Japan is now fixing the 10-year JGB interest rate and adjusting the balance sheet accordingly. We have developed a projection but with less confidence than our estimates for the Fed and the ECB. We are also assuming mostly steady exchange rates. This model shows that the rise in the S&P 500 can be explained by the combined effects of balance sheet expansion from the Federal Reserve, the BOJ and the ECB. It also suggests the upside is likely limited because the ECB will begin tapering next year and is projected to stop expanding its balance sheet by the end of Q3 2018.
Thus, one possibility is that continued balance sheet expansion by the BOJ and ECB has supported equities, offsetting the lack of Federal Reserve expansion. If this is the case, then ECB tapering and the end of its expansion and the uncertainty surrounding BOJ expansion may become significant headwinds next year. However, as noted above, we believe QE was mostly a confidence booster; there is little evidence it had much of an impact on the economy. At present, tax cuts and deregulation have lifted investor sentiment and supported higher equity prices. However, we will be watching to see whether the slow end of unconventional monetary policy abroad has an impact on equities next year.
[1] We discussed this issue at length in the summer of 2016. See WGRs, Thinking about Thinking: Part 1, 8/15/16; and Part II, 8/22/16.


