Daily Comment (March 28, 2016)
by Bill O’Grady and Kaisa Stucke
[Posted: 9:30 AM EDT] Trading was quiet overnight. Hong Kong and European markets are closed for Easter Monday, which limited market activity. On Good Friday, the Commerce Department issued the GDP report for Q4 (see below). In addition to our usual coverage, we want to highlight a couple of important charts from this report.
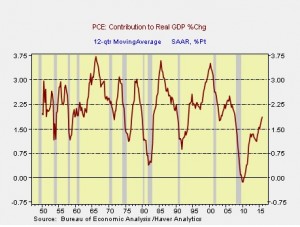
This chart shows the 12-quarter moving average of the contribution from consumption. As the chart shows, consumption collapsed during the Great Financial Crisis but has since rebounded sharply. Note that no recession has ever occurred with the measure rising. Improving consumption is probably the most favorable data on the economy.
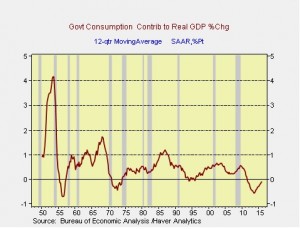
Perhaps the second most positive development for the economy is that government is almost no longer a drag on the economy. Now, in an age of deficits and fights over the fiscal budget, suggesting that the lack of government spending is acting as a drag on the economy seems illogical. However, we note that in the GDP calculation, government’s contribution to the economy is what government spends on “stuff”—bridges, tanks, roads, etc. That discretionary part of the budget has been dramatically squeezed in this business cycle, meaning the government has subtracted from growth at its fastest pace since the demobilization from the Korean War. However, as state and local government budgets improve, spending is also improving, adding to GDP.
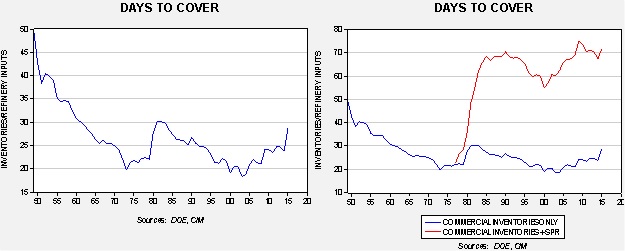
We have been getting a number of questions about our coverage of oil inventories. Due to the attention on oil prices and their tight correlation to equities, we have been regularly updating the oil inventory data in this report; we have been mostly focusing on the seasonal pattern in oil stockpiles. However, a number of readers have correctly noted that because demand is higher today, current inventory levels nearing the highs set in the 1930s is really not a fair comparison. This is true. So, to address these comments, we have created the two charts shown below.
To measure the level of inventory to demand, we divide oil inventories by the amount of crude oil that is used by refineries. That measure tells us how many days of inventory exist at the current refinery run rate. The chart on the left looks at commercial crude oil inventories only. Unfortunately, the DOE data only goes back to 1949, so we can’t capture the days to cover from the 1930s, but it is fairly clear that current inventory levels are not excessively high by this measure. In fact, inventories are only approaching the levels seen during the early 1980s when oil companies were hoarding oil due to the Iran-Iraq War.
However, there is another element to the story. In 1977, President Carter began filling the Strategic Petroleum Reserve (SPR) as part of an international effort to create an emergency supply buffer to counteract future supply disruptions from the Middle East or elsewhere. The actual availability of the SPR is always an issue—defining what constitutes a real emergency is difficult. On the other hand, the existence of the SPR probably does have some impact on storage management; before the SPR, commercial firms had to have large enough supply buffers to counteract events that might reduce supply. Once the government took over this role, firms were no longer required to keep storage on hand for emergencies. Thus, the right-hand chart is probably a more accurate snapshot of how much oil is available. Interestingly enough, the right hand chart tells us that the current level of stockpiles, relative to refinery operations, isn’t all that unusual.
Our analysis suggests that commercial crude oil stocks are more critical to oil prices than the SPR, although we have done work that suggests adjustments to the Strategic Reserve have an impact on prices. For example, in the fall of 1990, President George H.W. Bush ordered a test withdrawal from the SPR to see if it could be used in the case of war in Iraq. The very announcement coincided with the peak in prices (although we did see a new panic high on the day the air war started that was very short lived). In addition, his son’s policy of filling the reserve during his term likely boosted oil prices as well.
The bottom line is that when the SPR is included, oil stocks are ample and the rise in commercial inventories, which are unencumbered by policy, has an even greater impact. Simply put, a major recovery in oil prices, barring a geopolitical event, needs a reduction in the inventory overhang.


