Asset Allocation Weekly (August 24, 2018)
by Asset Allocation Committee
What is price stability? The working definition for the Federal Reserve was crafted by Alan Greenspan in 1994, when he suggested that price stability has been achieved when “…households and businesses need not factor expectations of changes in the average level of prices into their decisions.”[1] In other words, a central bank has achieved its price objective not necessarily when it has reached 0% inflation but when households and firms no longer take inflation (or deflation) into account when making purchase or investment decisions. This is probably the best answer to those who complain that 2% inflation is still inflation; although true, we have observed that no one seems to care about inflation around this level. Once the perception of price stability has been achieved, firms and households react to price increases by assuming the rise is due to particular factors in a specific market, not because of overall inflation. If prices rise in one market but economic actors don’t believe it’s due to an overall increase in the price level, then they are less likely to react to that specific price change by assuming they should buy other goods before prices increase there as well.
Assumptions surrounding price stability change how financial markets operate. If investors fear inflation, or, more accurately, when expectations of price stability are absent, then anything that increases the fear of inflation, such as currency weakness, will force the central bank to raise rates to offset that concern. The increase in interest rates will slow economic activity and weaken financial asset prices. Fiscal expansion can cause similar fears. On the other hand, when investors expect price stability, fiscal or monetary expansion is welcomed because it will support the economy and lift asset prices.
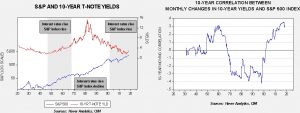
The chart on the left shows the 10-year T-note yield and the S&P 500 Index; the latter is on a log scale. The chart on the right is the focus of this analysis. Here we examine the 10-year moving correlation between the monthly change in the S&P 500 and the 10-year yield. Note that the change in the two series was positively correlated from 1946 into 1967; in other words, when the S&P rose, so did long-duration interest rates. From an investor’s perspective, the 10-year Treasury could act as a partial hedge to an equity portfolio. Because bond prices fell when rates rose, a portfolio holding bonds and stocks would tend to have lower risk. Under conditions of rising equity values, an investor would expect his bonds to fall in value and vice versa, meaning the same investor could expect his bond values to rise when equity values fell.
From 1967 into 2001, this correlation reversed its sign. When rates rose, the S&P fell. Thus, a portfolio of bonds and stocks, in terms of price, moved in the same direction. Now, as the chart on the right shows, in terms of overall direction, there was a bull market in both bonds and stocks from roughly 1985 to 1990. But, since we are examining this on a monthly change basis, there was still a tendency for rising interest rates to trigger equity weakness. The 1987 crash is an example.
Since 2002 into the present, the correlation sign has reverted back to the 1946-67 condition. This means that holding long-duration bonds in a portfolio will act as an effective hedge to an equity portfolio. In other words, when equity prices fall, the prices within the fixed income portion of the portfolio will tend to rise.
Modern portfolio theory postulates that holding two less than perfectly correlated assets will offer some degree of risk-adjusted outperformance. And, it is worth noting that the rolling correlation shown above isn’t ever all that strong, maxing out at around 0.4. So, even during the late 1960s into the early aughts, holding bonds did offer some diversification effect. However, when the correlation between bond prices and equities is inverse, it allows an investor to “hide” in fixed income during bear markets in equities. That tactic wasn’t available to investors from the late 1960s through the mid-1980s.
The key to the relationship between bonds and stocks involves expectations surrounding price stability. Price stability, in our opinion, rests on three legs. The first is globalization. By allowing firms and consumers to scour the globe for the best places to build productive capacity and source goods, price pressures are contained. The second is deregulation. Allowing firms to introduce new technologies and techniques into the economy without government interference supports efficiency and productivity. And, central bank independence is the third pillar. Allowing central banks to peruse the most appropriate monetary policy without political interference gives investors, consumers and firms confidence that inflation will not be allowed to erupt regularly for short-term political gain. We monitor the viability of these three legs constantly. Currently, the first is under fire and the third is facing threats as well. If these components continue to face pressure, expectations of price stability could erode and proper asset allocation will change, too. For now, we still expect price stability to be maintained but the threats are growing. If the threats rise to a level that undermines price stability, we will act accordingly.
[1] https://www.dallasfed.org/~/media/documents/institute/wpapers/2008/0008.pdf


