Asset Allocation Bi-Weekly – Bonds and the Post-Election Environment (November 25, 2024)
by the Asset Allocation Committee | PDF
The election results are in and, contrary to expectations, voters rendered a quick and clear outcome, with Donald Trump set to return to the White House. The central case prior to the election was that the outcome would be drawn out and contentious — an outcome that would tend to support flight-to-safety assets, such as long-dated Treasurys. However, in the wake of the actual outcome, a reassessment is in order.
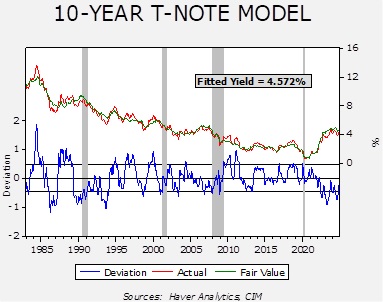
Our analysis of the long end of the yield curve starts with our yield model.
The model’s independent variables include the level of fed funds, the 15-year average of CPI yearly inflation, the five-year standard deviation of inflation, WTI oil prices, the yields on German and Japanese 10-year sovereign bonds, the yen/dollar exchange rate, the fiscal deficit scaled to GDP, and a binary variable for government control. As the model shows, yields are running below fair value but are within the expected range of outcomes.
As the election approached, despite the general consensus of a close race among the political pundits, the markets began to expect a GOP presidential win with a strong possibility of legislative control as well. In mid-September, the constant maturity 10-year T-note yield was 3.63%; it has increased to 4.45% in the wake of the election results.
A key issue is whether the yields will continue to rise in the coming weeks. Here are the factors we are watching:
- Our model’s government binary variable adds 30 bps to the fair value yield when there is a unified government. Since 1983, a situation where a single party controls both the executive and legislative branches usually results in greater spending and potentially higher deficits. We don’t apply that variable until the new legislature is seated, so we have not activated that variable quite yet. This variable will be in effect in January, though, which suggests there will be a bias toward higher yields.
- When yields peaked above 5% in late October 2023, the Treasury and the Federal Reserve acted in concert to bring yields lower. The Treasury adjusted its borrowing to the short end of the yield curve and Chair Powell signaled that the policy rate had peaked and was poised to decline. These actions sent yields lower to around 3.8% by late December 2023. Given that the current government is in “lame duck” status, we doubt that the Treasury will engage in similar behavior now. Thus, there will likely be greater tolerance for rising 10-year yields. In other words, although the Fed and the Treasury had signaled earlier that a 10-year yield above 5% was intolerable, that likely isn’t the case now.
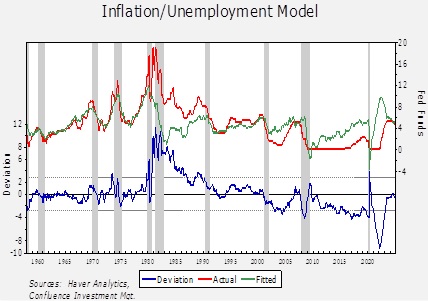
- Since the recent FOMC decision to cut 25 bps, another similar cut at the mid-December meeting is mostly expected by the markets. The unknown is what future policy will look like in the wake of recent political developments. A model based on the difference between overall yearly CPI and unemployment (an approximation of the Phillips curve) would suggest that the current policy rate is near neutral.
Anything beyond the anticipated 50 bps of cuts before year’s end will begin to move monetary policy into easing mode, which will be difficult to justify without a rapid weakening of the labor market or a drop in inflation. Without further cuts, it will be difficult for long-term yields to decline significantly.
Once President-elect Trump assembles his team at the Treasury, we could see action similar to what occurred in October 2023 to bring down long-duration Treasury yields. However, until then, there is a window where yields could rise to uncomfortable (e.g., >5%) levels. Thus, we believe investors should exercise care in extending on the yield curve into next year.


