

Asset Allocation Bi-Weekly – The Benjamin Button Dividend (September 16, 2024)
by the Asset Allocation Committee | PDF
A company’s journey to industry prominence typically involves several stages: launch, growth, shakeout, maturity, and decline. Historically, large capitalization stocks were often considered to be in the maturity stage of their development. Many investors therefore assumed that these companies had strong enough earnings to initiate or maintain dividend payments, making them seem more attractive than their smaller counterparts that were primarily considered for their capital gains potential. However, recent trends suggest that times have changed.
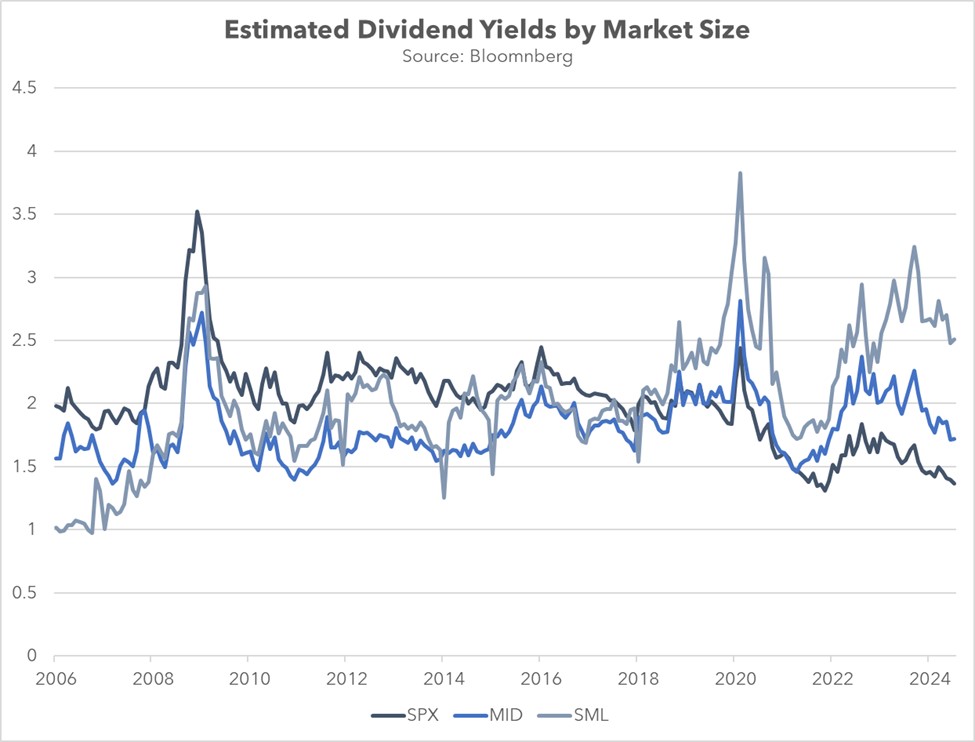
Over the past seven years, small cap stocks have consistently surpassed their mid-cap and large cap counterparts in terms of estimated dividend yields. This gap can be attributed to both relative price appreciation and dividend policy. During this period, the large cap S&P 500 stock price index grew nearly twice as fast as the mid-cap S&P 400 price index and the small cap S&P 600 price index. Additionally, small firms have significantly increased their dividend payout ratios relative to their larger peers, from just under 40% to over 60% in the last decade. In contrast, large cap firms have maintained relatively stable dividend policies over the same period.
The primary shift in the relationship between the small cap and large cap indexes has been driven by a changing sectoral composition, largely due to the survivorship and maturation of technology companies. As smaller tech companies have grown and become more successful, they have been rebalanced into the large cap index or were bought out. Meanwhile, those that failed to move up were removed. This dynamic has led to a significant increase in the weight of the tech sector within the large cap index at the expense of the small cap index.
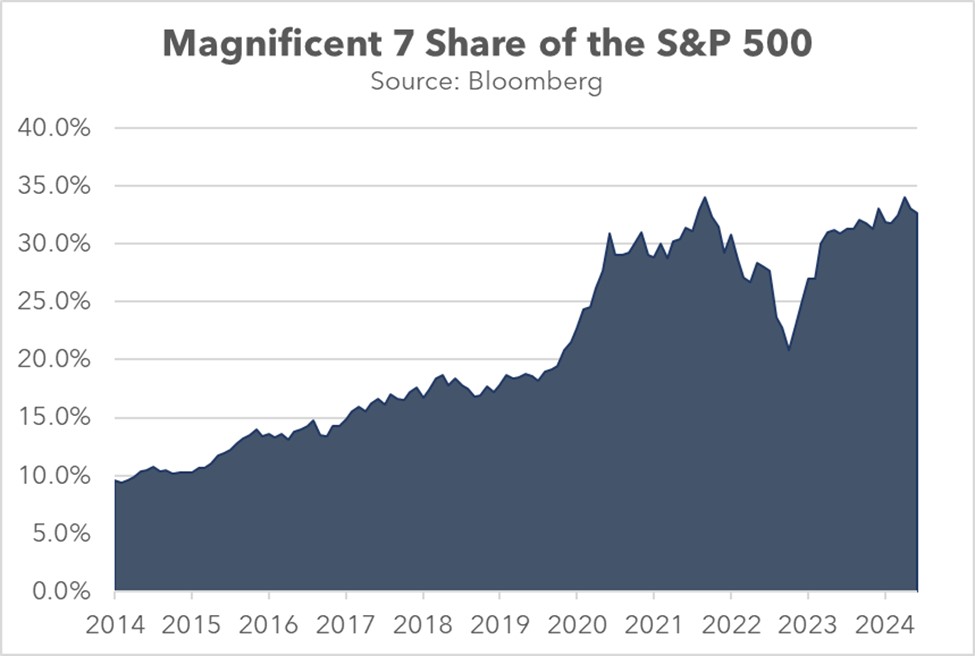
Over the past decade, information technology and communication companies have significantly increased their share of the large cap S&P 500 index, rising from 22.0% to 39.0%. In contrast, the small cap S&P 600’s exposure to tech companies has declined from 20.0% to 16.5%. As a result, the broad large cap index now exhibits more growth-like characteristics than its smaller counterparts. The S&P 500’s price-to-earnings ratio of 25.1 is substantially higher than those of the S&P 400 and S&P 600, which are each around 19.0. Moreover, the large cap index has become increasingly susceptible to price fluctuations in a select group of companies.
While tech companies have lost share within the small cap index, financial services and real estate firms have largely filled the void. Their rise was driven in part by low interest rates, which incentivized investors to seek assets with capital gains potential. This preference led to a surge in demand for large cap tech companies, which were perceived to have strong growth potential, at the expense of financial services and real estate firms, which paid dividends but were seen as less likely to appreciate significantly over time.
The substantial increase in the small cap index’s exposure to the Financials and Real Estate sectors is primarily attributable to reclassifications. Beginning in 2018, larger financial and real estate firms began to decline in market value, leading to their reclassification from the S&P 500 to the S&P 400. This trend intensified following the pandemic as many of these companies experienced further declines and they then made their way into the S&P 600.
These changes have resulted in a relative increase in the number of firms paying out substantial dividends within the small cap index. Over the past six years, the S&P 600’s exposure to financial and real estate companies has increased from 22.1% to 27.6%, while the S&P 500’s share has decreased from 17.6% to 15.7%. The S&P 400 saw a slight decline from 26.1% to 25.0% in its holdings of these sectors. Notably, the small cap index now has as many financial services and real estate firms as the large and mid-cap indexes had combined just 10 years ago.
Contrary to popular belief, a company’s size is not a reliable indicator of maturity. In fact, the average lifespan of S&P 500 companies has dramatically decreased in recent decades. The influx of tech companies into the large cap space has further accelerated this trend. In 1984, the average company survived 36 years, whereas today that figure is barely over 18 years. To put it into perspective, these companies are barely old enough to vote and not yet old enough to drink. This shorter tenure may explain why larger firms often exhibit less mature behavior than some of their smaller, dividend-paying counterparts, which have a weighted average lifespan of at least 32 years. In sum, investors seeking dividend income may now need to focus more on small cap companies than they did in the past.