Asset Allocation Bi-Weekly – Storm Warning (September 6, 2022)
by the Asset Allocation Committee | PDF
Throughout this year, there has been much talk (and confusion) about recession. Officially, the National Bureau of Economic Research is the formal arbiter of recession. This private group of economists assesses when there is a broad-based decline in economic activity and when that activity recovers. It then tells us when the recession began and when it ended. It’s important to note that it can be months after the recovery is underway that the recession is made official. The NBER isn’t making real-time calls on the business cycle. Thus, it’s never wrong, but it isn’t timely, either.
In the absence of an official designation, economists (and others) offer their insights as to whether the economy is in recession. A common rule is that two consecutive quarters of negative real GDP growth signals a recession. As rules go, it’s not a bad one as every time we have seen this measure met, a recession was usually underway. But we have also had recessions where this rule was not triggered. It’s also important to note that the historical data has been revised numerous times, and it is possible that we could see one or both negative quarters reversed. Since the beginning of the year, a parade of pundits and economists have weighed in on the topic. Our take has been that conditions are deteriorating, but we aren’t in recession…yet.
However, evidence is rapidly accumulating that a recession is on the horizon. Since the business cycle is so important to financial markets, we use a wide variety of sources to update us on business conditions, some of which are protected by copyright. Although we cannot disclose them publicly, we do note they are signaling a downturn. We also have ones we can share and others we have created ourselves. The following are a couple of useful charts.

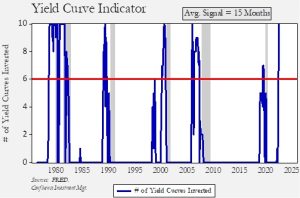
The yield curve is considered the most reliable signal of the business cycle available. Every inversion, where short-term interest rates rise above long-term interest rates, has preceded a downturn. However, this statement does not delineate “which” yield curve should be the determining one. After all, there are numerous permutations of yield curves available. To resolve this issue, we have created an indicator that uses 10 different yield curves[1] and counts them as they invert. Over the past 45 years, when seven curves have inverted, a recession always follows. Currently, all 10 have inverted. On average, a recession occurs in roughly 15 months with the fastest occurring in just eight months.
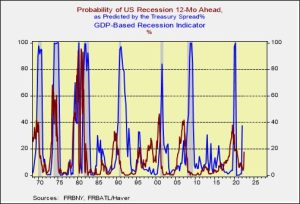
The following chart combines two indictors from the New York FRB and the Atlanta FRB. The former (the red line on the chart) uses the yield curve, while the latter works off GDP (the blue line). The New York FRB signals a recession with a reading greater than 40, whereas the Atlanta FRB trigger is a reading over 30. Neither is signaling a downturn at the moment, but both are quite close to a recession signal.

Our best estimate is that a recession will likely be evident by late this year or, more likely, in Q1 2023.
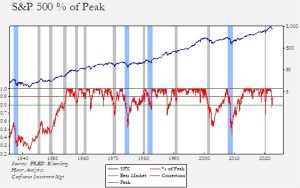
The chart below shows weekly Friday closes for the S&P 500. The lower line shows the index value compared to the previous peak. The variance with recessions is notable. In three of the four deep recessions, declines of around 50% occurred. In normal recessions, the declines were usually less onerous, although the 1970 and 2001 recessions had rather sizeable pullbacks. Most of the time, recessions coincide with weaker equity markets, but the degree of weakness varies.

In general, odds favor a normal recession (shown on the above chart with gray bars). Deep recessions (shown with blue bars) tend to be characterized by unusual situations. For example, the 1937 recession was caused by premature and excessively tight monetary and fiscal policy when the Fed raised rates and the Roosevelt administration tried to run fiscal surpluses. The 1973 recession had an oil and geopolitical crisis. The 1981 recession was characterized by extremely tight monetary policy to end persistent inflation, and the 2007 recession had a financial crisis. Currently, the financial markets are not expecting any of these outcomes as monetary policy is expected to pivot quickly in response to a decline in growth, inflation is expected to moderate, and no financial or geopolitical crises are anticipated. Obviously, vigilance is required, because bad recessions tend to be “black swan” sorts of events and the downside would be significant. Given current geopolitical tensions and disruptions to supply chains, there is certainly a case to be made that the expected recession has the potential to be a deep one. However, the more likely outcome is a milder downturn for equities.
With a 20% decline already recorded, there has been some discussion that a recession is already discounted. Although this outcome is possible, we think that the earlier pullback was more of a reflection of the removal of extreme stimulus. Thus, another “leg” lower when the recession arrives is more likely. Currently, we think a drop to 3500 would not be unreasonable.
[1] Specifically, we use the 10/1, 10/2, 10/3, 10/5, 5/1, 5/2, 5/3, 3/1, 3/2, and 2/1.


