Asset Allocation Weekly (April 20, 2018)
by Asset Allocation Committee
The Trump administration has made it a key policy goal to reduce the trade deficit. The reasoning is that reducing the trade deficit will boost jobs in areas that have been adversely affected by foreign competition. Although this might be true (trade is very complicated), the risk is that trade restrictions will likely result in higher inflation.
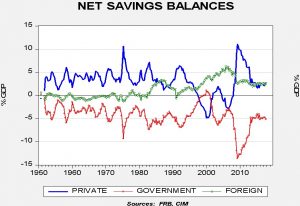
This chart shows net savings balances. These are macroeconomic identities, which, like a balance sheet, total to zero. However, how they reach zero is interesting. Usually, government dissaving (more commonly called a fiscal deficit) is offset by the combination of private and public sector saving. Foreign saving is the inverse of the current account; when a nation accumulates foreign saving, it is running a trade deficit. Private sector saving comes from the household and business sectors. For the former, it’s the difference between income and consumption. For the latter, it’s the net of revenue after investment. Thus, for the entire private sector, net saving is saving less investment.
Since the early 1980s, foreign saving has become a nearly permanent fixture. Most pundits argue that the U.S. must “attract” foreign saving due to the fiscal deficit. However, the direction of causality can be difficult to trace. For instance, under conditions of free trade, if a foreign nation purposely builds excess saving, that excess saving will become a trade surplus and the rest of the world must absorb that excess production (saving). If trade barriers exist, that excess saving is transformed into domestic investment, either by inventory accumulation or increased investment spending.
Because the U.S. is the provider of the reserve currency, it is the most likely target of foreign saving. Note that in the late 1990s, the U.S. ran fiscal surpluses with rising foreign saving inflows. There was a plunge in private saving, mostly due to business dissaving. Some of that increased investment was due to Y2K spending but some ended up bidding up existing asset prices (the tech bubble was partly a beneficiary). Ben Bernanke referred to a global “savings glut” in the last decade that is seen in the foreign inflows.
President Trump wants to reduce the trade deficit; if he is successful, he will also reduce foreign saving to the U.S. With the fiscal deficit rising, the private sector will be required to make up the difference. That can either come from falling consumption relative to income or falling investment relative to business saving. Falling consumption usually comes from either increases in inflation (which reduces real spending) or unemployment. Although reducing the trade deficit may benefit specific sectors of the economy, in reality, there are downsides to the policy.
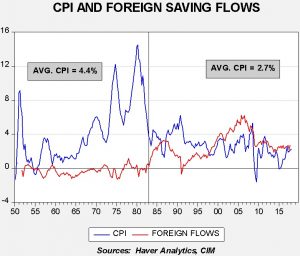
This chart shows the yearly change in CPI with foreign saving into the U.S. We have placed a vertical line on the chart, beginning in 1983, when foreign saving increased. During the period of small trade deficits (low for negative foreign saving), inflation averaged 4.4%. The onset of foreign saving has reduced inflation significantly.
The U.S. benefits from foreign saving inflows. It keeps inflation low and allows the U.S. to run fiscal deficits that would not be possible for other nations. For the most part, foreign nations accept this tradeoff to acquire the dollar for reserve purposes. The cost to the U.S. economy is that the trade is clearly unfair; foreign nations purposely build saving through policies designed to boost household saving. These include an undervalued exchange rate, consumption taxes, an inadequate or non-existent social safety net, tariffs and quotas. In one sense, if a foreign nation wants to deprive its citizens of goods and services and force them to save,[1] then the U.S. should accept their “generosity” and repay them with Treasuries. However, there are negative effects for some sectors of the economy that compete with imports.
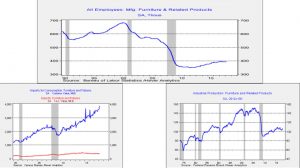
These charts show the U.S. furniture industry. The upper chart is employment. It has fallen by more than a third from the peak. The lower left-hand chart shows imports and exports (with the former rising rapidly) and the lower right-hand chart shows industrial output for furniture, which fell sharply during the last recession but has failed to recover anywhere near the previous peak. Clearly, this industry has been harmed by imports.
The trade issue is really a matter of who bears the burden of trade adjustment. Tariffs mean consumers bear the costs via higher prices. Subsidies mean taxpayers bear the burden. In the absence of either, the workers and owners in the U.S. bear the burden. However, in a macroeconomic sense, acts that raise the cost of imports will tend to bring higher inflation. If that becomes the favored policy, investors will face rising interest rates and falling P/E multiples. Thus, we continue to closely watch the president’s trade policy to for widespread effects and the impact on price levels.
[1] Something the U.S. did during wartime with rationing.


