Asset Allocation Weekly (August 18, 2017)
by Asset Allocation Committee
A number of market commentators have suggested current conditions are similar to 1987. Complacency, shown by the low level of volatility and an elevated P/E, is rampant. On the other hand, there is no evidence a recession is looming and, although monetary policy is tightening, the Federal Reserve has been raising rates at a slow pace and financial conditions remain at low stress levels.
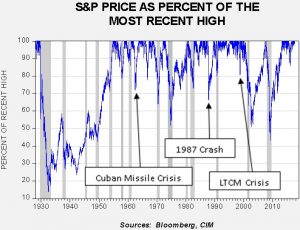
This chart can help us examine the potential for a correction.
To create this chart, we looked at the daily close for the S&P 500 Index starting on the first trading day of 1928. Each subsequent close is measured against the most recent closing high. A reading of 100% means a new high has been attained. Recessions, shown by the gray bars, tend to have a negative impact on equities; the effect was most obvious during the Great Depression. We have also noted a few events of interest on the chart.
There are currently two areas of concern. The first is that the North Korean situation could escalate; clearly, if we have a military event that includes nuclear weapons, then we are in uncharted territory and none of the above history is relevant. However, we do have the Cuban Missile Crisis as an analogue. From the S&P 500’s recent closing high of 2490, a repeat of that crisis would trigger a pullback to 1785. Although that would be sizeable, note that the market recovered quickly. At present, tensions have cooled and we don’t expect a military event in the near future.
The second area of concern is tied to market complacency. Market volatility has been very low and investors have been shorting volatility successfully for some time.

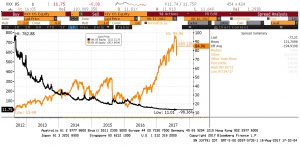
This chart shows the VIX ETF (VXX, 11.75) and the inverse VIX (XIV, 84.96). This five-year chart shows that those who have been long volatility have suffered steady losses, while those short volatility have generally done well. However, the gains on being short volatility have accelerated over the past two years. There have been reports that portfolio managers have been using short volatility in a fashion similar to portfolio insurance in the 1980s. Portfolio insurance was one of the causal factors of the 1987 Stock Market Crash, shown on the above chart. Short volatility has become a crowded trade. If investors reverse these positions quickly, it could create conditions similar to 1987. A repeat of that outcome yields an S&P of 1636.
It is important to note that in both the 1962 and 1987 events, the economy avoided recession and equities recovered quickly. Clearly, past performance doesn’t guarantee future outcomes, but as long as a market correction event isn’t driven by a recession then we would expect the decline to be short-term in nature.
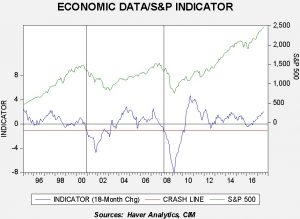
Recently, we introduced an economic data/S&P indicator.[1] It does not suggest a recession-driven market drop is imminent.
The green line is the monthly average for the S&P 500; the blue line is an indicator built of three economic numbers—initial claims, the CRB commodity index and the Conference Board’s Consumer Confidence data. We have standardized the economic data and created an indicator, shown on the bottom of the graph. In general, a positive reading is generally bullish for equities. We have placed vertical lines on the chart to indicate when the indicator turned negative with persistence. These are usually periods of falling equities. This model would tend to suggest that a pullback caused by economic weakness isn’t in the offing, and so an event-driven pullback, though potentially painful, would probably be short-term in nature.
[1] See Asset Allocation Weekly, 6/30/17.


