Asset Allocation Weekly (June 23, 2017)
by Asset Allocation Committee
The FOMC did raise rates at the June meeting, which was fully expected. The dots chart suggested that we would see one more hike this year and three next year. In addition, the central bank gave some indication of how it would shrink its balance sheet. Although the statement didn’t signal when the reduction would begin, Chair Yellen indicated in the press conference that it would begin before year’s end and seemed to hint it may start much sooner than the market expects.
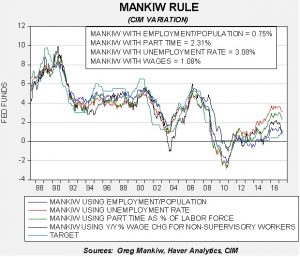
In this report, we want to examine two concerns we have about the path of policy tightening. The first concern is the level of the policy rate. To measure the impact of the policy rate, we use the Mankiw Rule. The Mankiw Rule models attempt to determine the neutral rate for fed funds, which is a rate that is neither accommodative nor stimulative. Mankiw’s model is a variation of the Taylor Rule. The latter measures the neutral rate using core CPI and the difference between GDP and potential GDP, which is an estimate of slack in the economy. Potential GDP cannot be directly observed, only estimated. To overcome this problem with potential GDP, Mankiw used the unemployment rate as a proxy for economic slack. We have created four versions of the rule, one that follows the original construction by using the unemployment rate as a measure of slack, a second that uses the employment/population ratio, a third using involuntary part-time workers as a percentage of the total labor force and a fourth using yearly wage growth for non-supervisory workers.
Using the unemployment rate, the neutral rate is estimated at 3.08%. Using the employment/population ratio, the neutral rate is 0.75%. Using involuntary part-time employment, the neutral rate is 2.31%. Using wage growth for non-supervisory workers, the neutral rate is 1.08%.
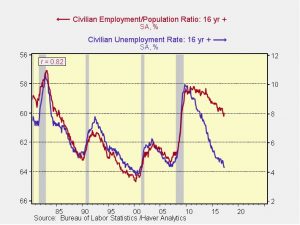
The labor data has been mixed during this recovery. The unemployment rate has fallen sharply, but other measures, most notably the employment/population ratio, have fallen much more slowly.
If the relationship between the unemployment rate and the employment/population ratio that existed from 1980 through 2010 had remained the same, the current unemployment rate would be closer to 7.5%. Using the above Mankiw Rule with a 7.5% unemployment rate and the current core inflation rate would generate a neutral policy rate of -0.61%! In other words, not only would the FOMC not be tightening, but cutting the balance sheet wouldn’t be considered either.
The conventional wisdom is that the employment/population ratio is being affected by retirements and thus the labor market slack isn’t as great as that indicator would suggest. However, we note that wage growth is much more consistent with the employment/population ratio than the unemployment rate. Thus, there is a legitimate worry that the Fed may overtighten and put the economy at risk. Currently, the financial markets only expect one more tightening over the next two years; if the dots plot is the path of policy, the odds of a recession will rise.
If the employment/population ratio is the accurate measure of slack, we are already 37 bps above neutral. Policy would be tight at 100 bps. Thus, we are two to three hikes from putting the economy at risk. Of course, the ratio could improve or inflation could rise, but without those events occurring, the risk to the economy from tighter monetary policy is rising.
The second concern is the balance sheet. The actual effect of QE on the economy is difficult to determine. We tend to think that the most likely impact was that the balance sheet expansion confirmed that the Fed was determined to execute an easy policy even with the policy rate at zero. The level of the balance sheet appears to have had a strong effect on investor sentiment.
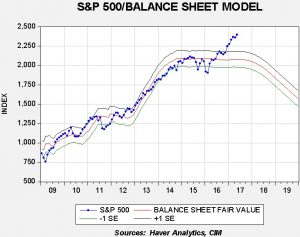
This chart forecasts the S&P 500 by using the size of the balance sheet. From 2009 into late last year, this equity index closely followed the balance sheet. After the election, equities shifted focus toward expectations of tax reform and fiscal expansion.
We have extended the forecast generated from the balance sheet using the FOMC’s stated plan for reducing the balance sheet and assuming the reduction begins in September. The Fed intends to start slowly, only $10 bn per month, reaching $50 bn after a year. It is obvious that the balance sheet could become a headwind by 2018. This above chart isn’t our forecast for equities but it does suggest that the combination of rate hikes and balance sheet reductions is signaling that monetary policy will tend to become a headwind for equities. If the Trump administration fails to move forward with tax reform or infrastructure spending, equity markets will be vulnerable to a correction.


