Asset Allocation Weekly (June 30, 2017)
by Asset Allocation Committee
For equity investors, there is always a concern about the major market declines; being able to reduce market exposure prior to crashes like the ones in 2000 or 2008 is always desirable. Although large declines have occurred outside of economic recessions, they have become increasingly rare. The last major market pullback absent a recession was the 1987 crash. Thus, an indicator that can use high frequency economic data (data that is available on a weekly basis) and relate it to equities should have some value.
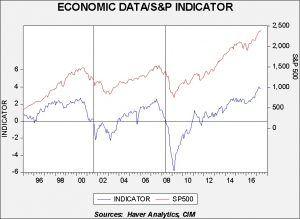
This chart shows one of our recent efforts. The upper line is the monthly average for the S&P 500; the lower line is an indicator built of three economic numbers—initial claims, the CRB commodity index and the Conference Board’s Consumer Confidence data. We have standardized[1] the economic data and created an indicator, shown on the bottom of the graph. In general, a positive reading is generally bullish for equities. We have placed vertical lines on the chart to indicate when the indicator turned negative with persistence. These are usually periods of falling equities.
Although useful, it is clear that the indicator is somewhat “late” in that the equity decline is well underway by the time it becomes negative. That would suggest that a momentum number based off the economic indicator might be helpful.
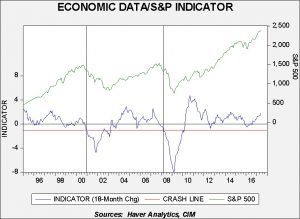
To achieve this, we calculated the 18-month change in the above indicator and set a “crash line” at -1.0. The adjustment improves the indicator’s value, indicating an investor should reduce equity exposure sooner than the unchanged index would suggest. At the same time, using a -1.0 reading eliminated the false exit signals.
There is an element of “data mining” here and we would not recommend using this indicator as a “precision instrument.” However, it does show that these three standardized data points are fairly good coincident indicators of the economy and, using an 18-month change and a filter, do offer reasonably good warnings when one should reduce exposure and when a market pullback is a mere correction.
We use the period since 1997 because it makes the data easier to observe. But, we did look at data from 1980 and the performance is similar. As we would expect, the indicator did not help at all during the 1987 crash, confirming that its usefulness is as a gauge of the interaction between equities and the economy, not as a pure market indicator.
What is it telling us now? The economy is doing well enough that market declines will probably not be more than normal pullbacks. Of course, this sort of indicator won’t necessarily be helpful if a geopolitical event triggers a major market decline. But, the most common cause of bear markets in equities are recessions. For now, that doesn’t appear to be on the horizon.
[1] Standardizing entails subtracting the raw data by its average and dividing by its standard deviation. The resulting number is then adjusted by how far it is from average and how far it is from its normal deviation. Standardizing allows one to combine unlike indicators and essentially balance their relative effect. In this case, the formula is Indicator = (standardized CRB + standardized Consumer Confidence) – standardized Initial Claims. We subtract the claims data because lower claims indicates a stronger economy. Subtracting that number thus allows the indicator to rise when economic data are improving and vice versa.


