Asset Allocation Weekly (October 25, 2019)
by Asset Allocation Committee
For nearly two years, the energy sector has dramatically underperformed the overall equity market and oil prices.
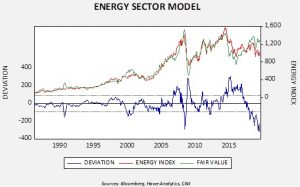
This chart shows our S&P energy sector model. We regress the overall S&P 500 and oil prices against the energy sector. For most of the index’s history, these two variables explained much of the behavior of the energy sector. The deviation line shows that this is the most significant underperformance of energy over the past thirty years. The current underperformance was preceded by strong outperformance in the two previous years.
So, why are we seeing this underperformance? It isn’t exactly clear. There are a number of candidates to explain the deviation. It may reflect a correction from the earlier outperformance that was likely based on euphoria surrounding fracking. There may be an element that, due to fears of climate change, hydrocarbons are falling into “pariah” status. If this is the case, there may be a long-term underweighting of energy stocks going forward. It may be that energy equity investors believe oil prices are too high and simply won’t “pay up” for equities to match current prices.
We are not sure which factor accounts for the underperformance but it does pose a problem for asset allocation. Energy is only 2.6% of the growth index for the S&P 500 but 6.4% of the value index. If an investor wanted to tilt his/her portfolio toward value due to concerns about a slowing economy but was worried that the underperformance of energy is a secular trend, the tilt to value might leave that investor with an excessive allocation to energy. Our Asset Allocation Committee recently faced this problem. To deal with this issue, we added a quality factor product to our Asset Allocation portfolios, which will still give us the defense posture without a large energy component. This is one way to address the higher proportion of energy in the value index and create a more defensive posture in asset allocation.


