Asset Allocation Weekly (October 26, 2018)
by Asset Allocation Committee
One of the earliest lessons taught in statistics is that “correlation does not equal causality.” Any relationship that exists between two variables usually rests on a myriad of conditions; if any of these conditions change, correlations can break down rapidly. This doesn’t mean that correlation isn’t a useful tool but it show that one must be aware of the conditions that support the relationship. If those conditions prove to be unstable, the resulting correlation can be unreliable. In addition, when a correlation breaks down, it’s important to figure out why. Sometimes the change in correlation is understandable; in other circumstances, it can signal more ominous problems.
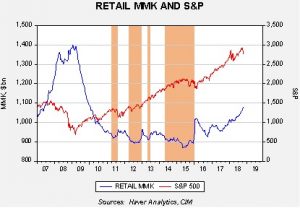
This chart shows the level of retail money market funds along with the S&P 500 on a weekly basis. We have highlighted four periods. These periods show that equity performance stalls when the level of retail money market funds falls below $920 bn. It would seem that households had a minimum level of desired liquidity and if that level falls below that minimum then households would liquidate financial assets to rebuild cash. After money market funds were rebuilt, equities tended to recover.
It appears that this relationship is breaking down. We have seen choppy equity performance this year with money market funds continuing to rise; in other words, households have levels of cash available that, in recent years, would have led to equity purchases. So, why did this relationship break down? Although there could be a myriad of reasons, here are the two we think are most likely.
Current interest rates are attractive to investors. After years of near-zero interest rates on cash and near-cash instruments, current yields look remarkably high.
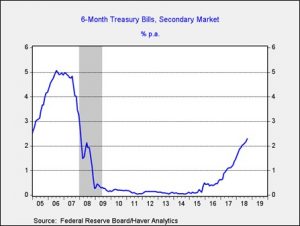
This chart shows the six-month T-bill rate; in the middle of 2015, the yield was a mere 9 bps. The current yield is 2.29%. Although this is still a low rate historically,[1] the perceived penalty for holding cash is much less onerous than three years ago.
There are rising levels of fear among investors. Fear is hard to define but here are three potential concerns that are probably reducing enthusiasm for equities.
- Monetary policy tightening is raising the risk of recession. Business expansions don’t end “naturally.” The usual causes are excessive monetary policy tightening or a geopolitical event. Although the FOMC is raising rates, we are not yet at a level that would be considered tight by any measure. Real fed funds remain below zero; the past three recessions occurred with real fed funds in excess of 2.5%. That would imply a fed funds of nearly 5% based on the current overall CPI of 2.3%. However, the 2008 Financial Crisis may have changed how the economy works and thus there may be greater sensitivity to policy tightening. The FOMC does appear cognizant of this risk and is moving rates up slowly.
- Fears of a change in the inflation regime. After peaking at 14.8% in March 1980, overall CPI has averaged a mere 2.6% since 1985. The Federal Reserve is given much of the credit for this development, although we believe globalization and deregulation played a much larger role in keeping price increases contained. Unfortunately, these two factors also tend to cause inequality and there is growing political backlash against both. President Trump’s changes to trade policy and the rising criticism against technology companies are, perhaps, a signal of a regime change. The fact that we have seen weak equities and rising long-duration yields simultaneously may be signaling that concerns about the inflation regime are rising. However, our analysis suggests that most of the recent rise in long-dated yields can be explained by monetary policy tightening. If the inflation regime changes (inflation expectations become unanchored, using “Fedspeak”) we would expect further price weakness for equities and long-duration debt.
- Lingering fears of 2008. The 2008 Financial Crisis was a generational event, undermining investor faith in markets and policy. After the Great Depression, it took investors years before confidence returned.
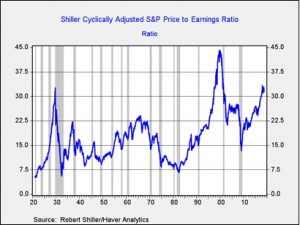
This chart shows the Schiller CAPE. Although there were occasional bounces when the P/E rose above 15x after the Great Depression, it wasn’t until the late 1950s that we saw a sustained rise in multiples. That has not been the experience of the equity market thus far but the market has also been supported by extraordinary policy support. Although anecdotal, in our travels talking to investors, we hear a nearly universal comment that, “I can’t suffer through another event like 2008 again.” Thus, it would not be unreasonable to see investors move to cash if they see even faint signs of recession.
So, what do we glean from this analysis? Rising rates are looking attractive to some investors, especially those with high levels of risk aversion. At the same time, even 3.0% on T-bills isn’t much of a return and probably has had a limited impact on equities. The fear section is more telling. If the primary fear is overly tight monetary policy, then any hint of a pause should be bullish for equities. That’s especially true given high cash levels. A regime change in inflation is perhaps the greatest threat; there are clearly changes occurring that are worrisome but the general realization that the regime has changed takes time. We are watching this issue carefully but, so far, we are not ready to declare a change. If regime change were the primary factor, long-term interest rates would be rising much faster. The fear of another 2008 will be with investors for a generation. That fear may lead to more frequent corrections, especially under conditions where monetary policy isn’t overtly accommodative. In some respects, that is a healthier situation for equity markets as it reduces the odds of bubbles. Our take is that the primary factor behind the rise in cash is monetary policy tightening.
[1] The average rate since 1970 is 5.04%.


