

by the Asset Allocation Committee | PDF
- We expect near-trend growth and no recession over our three-year horizon.
- Business investment and productivity gains should sustain the expansion.
- Additional Fed tightening is expected in the near term, resulting in inflation moderating over the forecast period.
- The Middle East conflict remains a source of growth and inflation risk.
- We added mid-cap exposure while retaining large cap and selective small cap holdings.
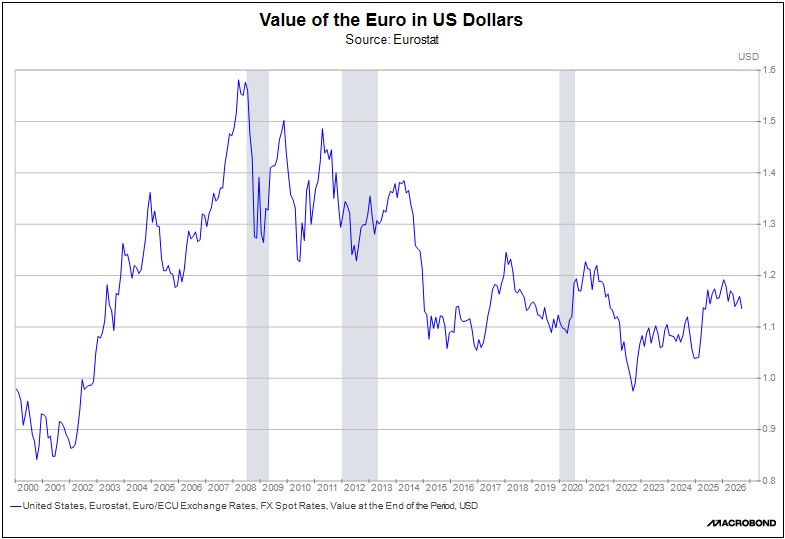
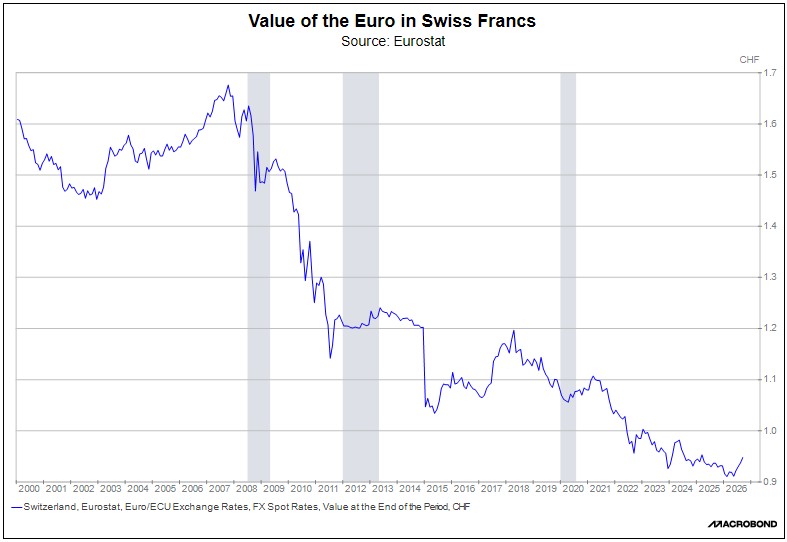
- We removed the Europe overweight given concerns about energy supply issues and political uncertainty.
- We maintain positions in Treasurys, MBS, and gold.
ECONOMIC VIEWPOINTS
The US economy is entering a period in which the durability of growth matters more than its magnitude. Geopolitical uncertainty, weakening consumer sentiment, and expectations of tightening monetary policy threaten to slow activity, but sustained business investment provides an important counterweight. Our base case calls for an expansion near long-term trend over the next three years supported by continued spending on artificial intelligence (AI), infrastructure, and domestic productive capacity.
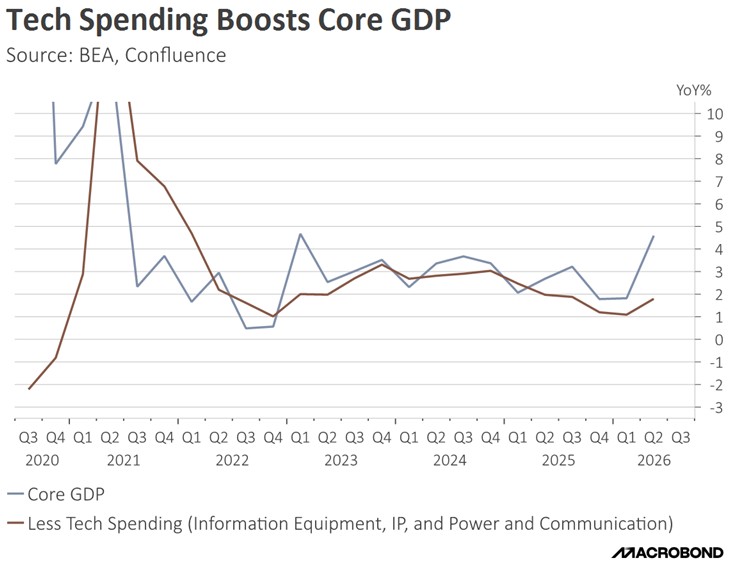
Technology-related investment has become an important source of economic growth, as the accompanying chart shows. The economy outside technology spending continues to expand, but the widening gap highlights the additional support provided by this investment cycle. Spending on computing capacity, software, and infrastructure creates demand today, but its longer-term value depends on whether businesses use that capacity to produce more efficiently. As spending growth eventually moderates, actualized productivity improvements should become increasingly important in sustaining output and profitability. We expect early gains in financial and professional services through faster research, document processing, and customer support, alongside improvements in industrial maintenance, production scheduling, and inventory management. These benefits should extend beyond US technology companies to businesses across developed markets and selected emerging economies, although adoption and earnings gains will vary.
Inflation remains an important influence on the pace and durability of growth. Persistent price increases erode household purchasing power, raise business costs, and limit the scope for monetary easing. The key question is whether inflation continues to moderate or becomes more entrenched through wage demands, pricing decisions, and expectations. Our base case assumes inflation will trend lower over the forecast horizon toward the Fed’s 2% target, though services prices, tariffs, and high energy prices are likely to keep progress uneven. We expect the acute effects of the Iran war to dissipate within the three-year forecast period, easing one source of inflation pressure without necessarily resolving the others.
This creates a difficult timing problem for the Federal Reserve. Technology investment supports demand immediately, while its potential productivity benefits develop gradually. Over time, greater efficiency and productive capacity could help contain inflation without requiring a substantial slowdown in growth. Until those benefits become more widespread, the Fed must maintain enough restraint to prevent persistent inflation while avoiding unnecessary damage to demand.
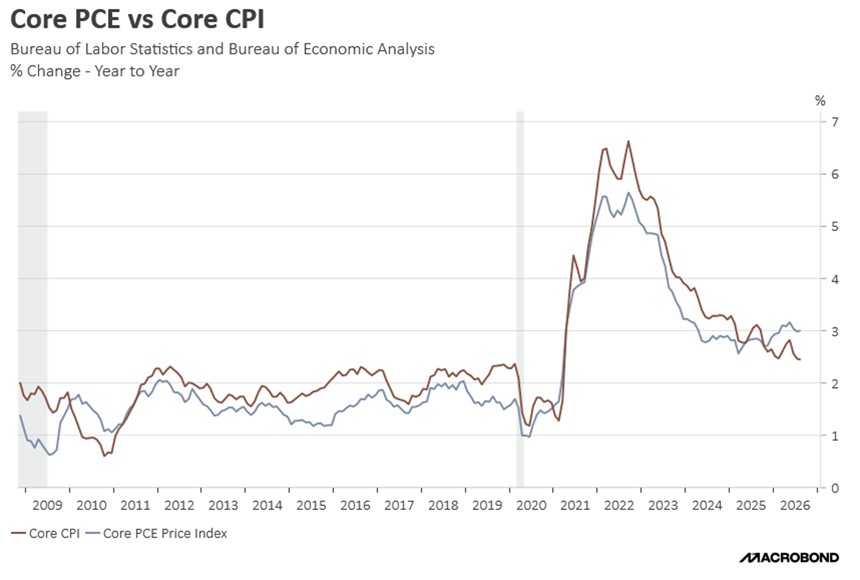
While excessive tightening remains a risk, we expect the Fed to calibrate policy carefully as economic conditions evolve. Monetary policy works with a lag, so its strongest effects could arrive just as energy pressures fade and investment growth slows. While consumer weakness may become more visible later in the forecast period as lower-income households become exhausted by price pressures, we expect continued investment and broader productivity gains to help offset that moderation, supporting an expansion that remains intact but becomes more uneven across households and businesses.
The course of the conflict in the Middle East and its effect on energy prices will influence the pace of economic growth. A prolonged disruption would weigh on household purchasing power and business margins, while a resolution could ease inflation pressures and support demand. Our base case assumes the conflict is resolved within the forecast period. While we continue to expect economic expansion, a more persistent disruption could weaken that outlook.
STOCK MARKET OUTLOOK
We expect earnings growth to become a more consequential driver of equity returns over the medium to longer term, with less support from multiple expansion. Investor enthusiasm surrounding AI has supported a concentrated rally in mega-cap technology companies, bringing forward expectations for future growth and profitability. Continued AI investment should bolster economic activity, but companies will increasingly need to demonstrate that spending translates into profitable growth and attractive returns on capital. As productivity benefits spread across industries, earnings opportunities should broaden beyond the companies building AI infrastructure to those using it to improve efficiency and margins. This creates scope for wider market participation without requiring a sustained increase in valuation multiples. We therefore remain constructive on equities, while expecting greater differentiation based on profitability, capital discipline, and the price investors pay for future earnings.
We continue to favor US large caps and, where risk appropriate, we have added a broad-based mid-cap holding, while retaining selective small cap exposure. We see opportunities in mid-cap companies with attractive relative valuations and improving earnings prospects as capital investment and productivity gains broaden beyond the largest firms. Lower-risk portfolios maintain a value tilt, while higher-risk portfolios modestly emphasize growth. We expect stronger earnings growth to balance the limited scope for valuation expansion, so this positioning is better suited for investors with a greater tolerance for volatility. We favor energy, defense, and industrial companies, supported by infrastructure spending, reshoring, and national security investment. Dividend-oriented ETFs provide income that can help cushion volatility, while our small and mid-cap allocations continue to emphasize quality and dividends.
We continue to see opportunities in international equities given attractive relative valuations, diversified earnings exposure and improvements in corporate profitability and capital allocation. However, this quarter we removed the dedicated overweight to Europe, reflecting concerns about energy supply, political uncertainty, and structural growth constraints. Europe remains represented within our broad-based international developed market position, preserving exposure to its investment opportunities while reducing our prior regional emphasis.
We increased emerging market exposure in our Aggressive Growth portfolio, including a dedicated allocation to Latin America. The region offers exposure to energy, metals, and other resources that could benefit from infrastructure investment, electrification, and efforts to diversify global supply chains. Selected markets also offer attractive relative valuations and dividend income, while potential monetary easing could support domestic activity as inflation moderates. These opportunities remain subject to currency volatility, commodity cycles and country-specific political risks. We believe the increased allocation provides a complementary source of potential returns alongside our developed market holdings.
BOND MARKET OUTLOOK
We expect further monetary tightening in the near term but eventual easing later in the forecast period as inflation moderates and demand softens. Excessive tightening remains a risk, particularly if the delayed effects of higher rates intensify just as inflation pressures are subsiding.
We continue to favor high-quality fixed income, maintaining overweight positions in Treasurys and mortgage-backed securities (MBS). We expect yields to be the primary contributor to returns, with selective opportunities for price appreciation as monetary policy shifts toward easing later in the forecast period. Treasurys provide liquidity and potential diversification during periods of economic uncertainty, while agency MBS offer additional yield with limited credit risk. The yield curve could flatten as short-term rates rise, and our preference is for allocations in the short and intermediate duration. This backdrop reinforces our emphasis on income, quality, and disciplined management of interest rate risk.
We modestly increased exposure to longer maturities, positioning the portfolios to benefit from current higher yields while preserving flexibility should interest rates or credit conditions evolve differently than expected. We remain selective in investment-grade corporate bonds. Tight corporate spreads leave limited room for further compression and little cushion against earnings disappointments or deteriorating credit conditions. Financing needs associated with AI infrastructure and other capital spending could also increase bond supply, placing pressure on spreads and reinforcing our preference for higher-quality alternatives. We favor selective exposure to higher-quality speculative-grade bonds, particularly BB-rated issuers, for their attractive income potential while limiting exposure to weaker credits.
OTHER MARKETS
We retain gold across all strategies as a portfolio diversifier and a potential stabilizer during periods of geopolitical, inflationary, and currency uncertainty. Over our three-year forecast period, we expect central bank reserve diversification and demand for a store of value to remain supportive.