by the Asset Allocation Committee | PDF
- We expect resilient economic growth in the short term, with slowing occurring toward the later end of the forecast period.
- Our three-year forecast does not anticipate a recession.
- Inflation rates will be volatile and are likely to remain above the Fed’s target rate.
- We anticipate the Fed will ease gradually over the next two years as monetary policy continues to be guided by economic data.
- Domestic equities continue to hold relative attraction, while international stocks face increasing uncertainty.
- The potential for elevated volatility in global risk markets reinforces our allocations to domestic longer-duration bonds and gold.
ECONOMIC VIEWPOINTS
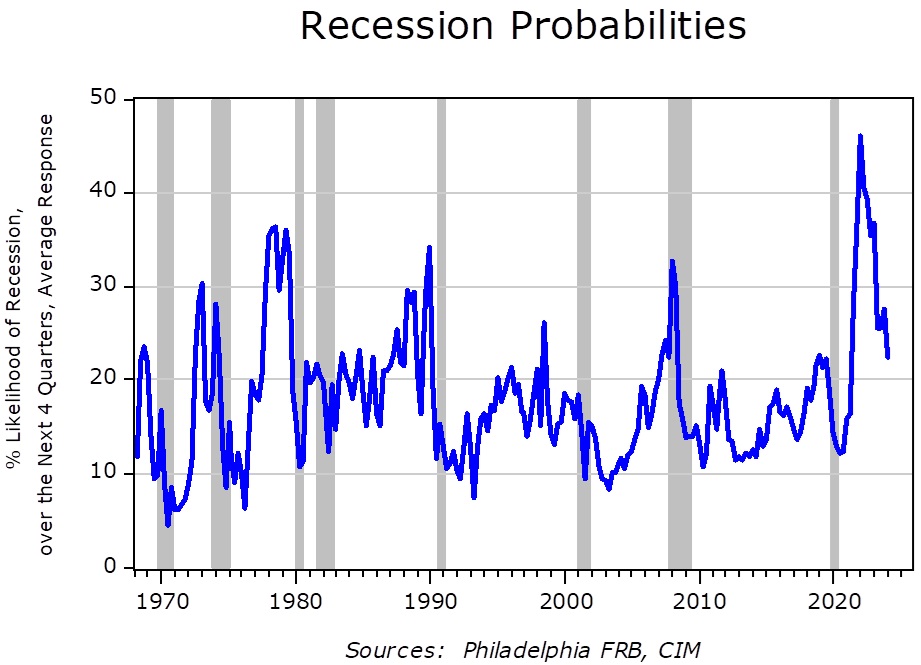
Our forecast expects economic growth to remain resilient in the near term, supported by a strong labor market, robust consumer spending, fiscal support, and the likely extension of tax cut policies. An economic soft landing seems plausible as domestic economic activity measures have stabilized. The yield curve has shifted to an upward slope, though it remains relatively flat, reflecting market expectations of a reduced likelihood of an economic slowdown. The Philadelphia Fed’s recession likelihood survey also indicates a decreasing probability of a recession, which further supports our view of no recession in the next three years.
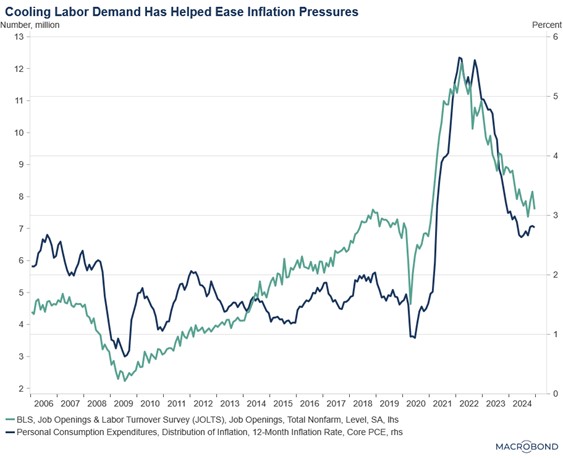
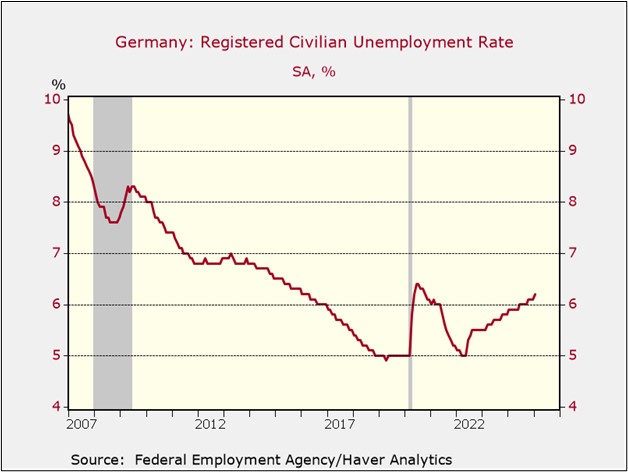
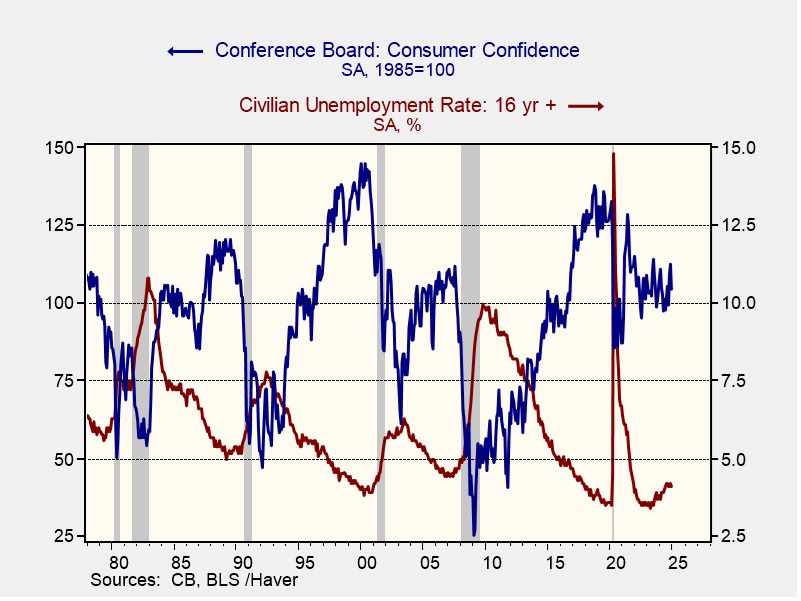
Consumer spending accounts for a significant portion of GDP; as such, labor market health directly correlates with economic expansion. Despite a recent slight uptick in the unemployment rate, we view the labor market as robust, characterized by wage growth and labor hoarding. We believe the structural forces of aging demographic trends and ongoing uncertainty around immigration policies are likely to continue supporting labor market conditions by keeping the labor supply tight.
While labor supply constraints can boost wages, persistent labor shortages and rising labor costs could limit business expansion and create a drag on overall economic performance in the longer term. Moreover, wage increases that outpace productivity could lead to lower margins and rising consumer inflation. We may see these scenarios emerge during the forecast period as new immigration policies are enacted.
We expect consumer confidence will continue to play a pivotal role in sustaining economic growth. Households have maintained spending levels due to higher wages, government support programs, and optimism about economic stability. However, inflation concerns remain a key factor affecting consumption patterns. In the long run, rising prices erode purchasing power and lead consumers to reduce discretionary spending. If the FOMC tightens monetary policy to address inflation, it may further encourage cautious spending behavior.
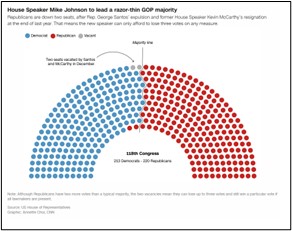
The new administration’s economic policies also introduce an additional layer of uncertainty. Potential trade actions, fiscal adjustments, and regulatory changes could create volatility across global markets. The economic impacts of tariffs are complex and hard to predict. In the near term, these restrictions may provide a boost to the domestic economy. However, over the long term, supply-side constraints could negatively impact both consumer spending and business profitability.
STOCK MARKET OUTLOOK
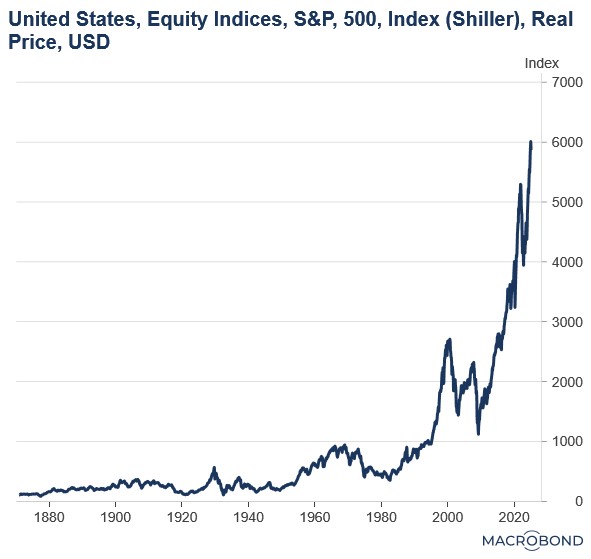
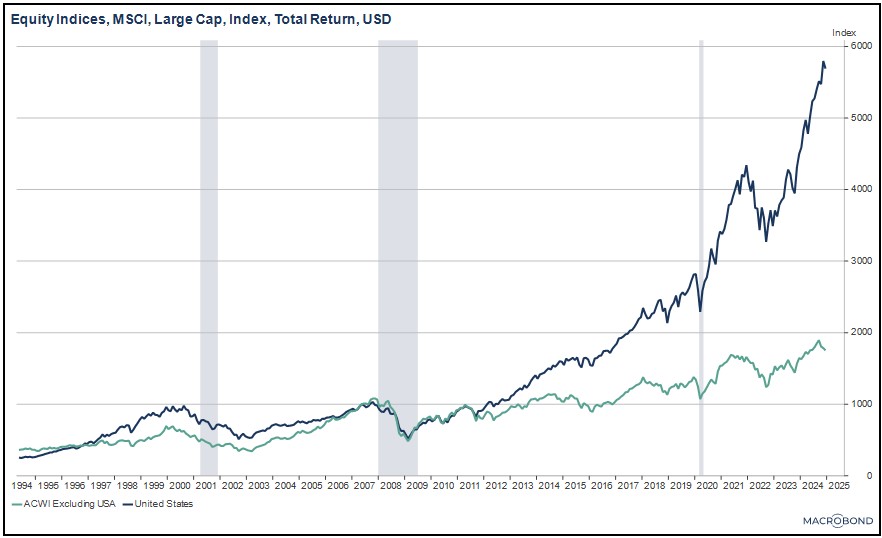
We maintain a positive outlook for domestic equity markets across market capitalizations. The policies of the new administration are likely to be advantageous for large companies, and therefore we expect last year’s upward momentum to persist in the near term. Also supporting domestic equities, in general, and large caps, in particular, are the historically high levels of cash on the sidelines, continued international fund flows, and the prevalence of passive index investing, which tends to disproportionately benefit the largest market capitalizations. At the same time, large caps are trading at elevated valuation levels compared to historical measures and relative to other equity assets. History suggests these divergences are unlikely to continue in the long term. Although today’s equity landscape appears healthy, concerns about excessive pricing could lead to a normalization of valuations over the long term.
We are even-weight on the growth/value style bias. Despite the concentration risk associated with a select group of prominent growth stocks, we believe the prevailing economic conditions will provide support for a broader group of equities. Large cap equities should continue to benefit from the anticipated policy environment and passive flows, while small and mid-cap equities offer valuation expansion potential. In the lower capitalizations, we maintain a quality factor geared toward companies that meet the criteria of profitability, quality of earnings, and low leverage.
This quarter, we transitioned our Aerospace & Defense exposure from military hardware to advanced defense technologies including artificial intelligence (AI), robotics, cybersecurity, and other innovative military applications. At the same time, we maintain our standalone cybersecurity position as international tensions are increasingly playing out in that domain. The anticipated new domestic energy policies are likely to boost supply and lead to falling prices, which prompted us to exit the overweight to the Energy sector. Given the evolving energy demands driven by advanced technologies, including AI, we continue to maintain our allocation to uranium miners.
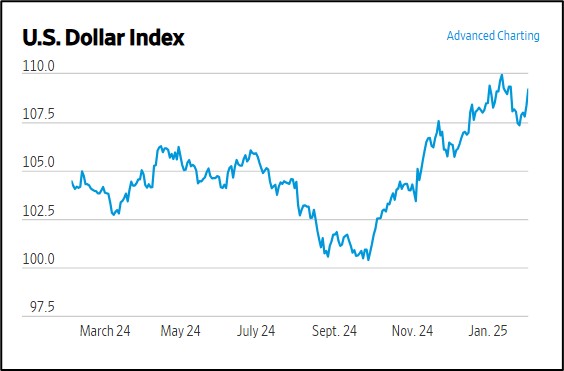
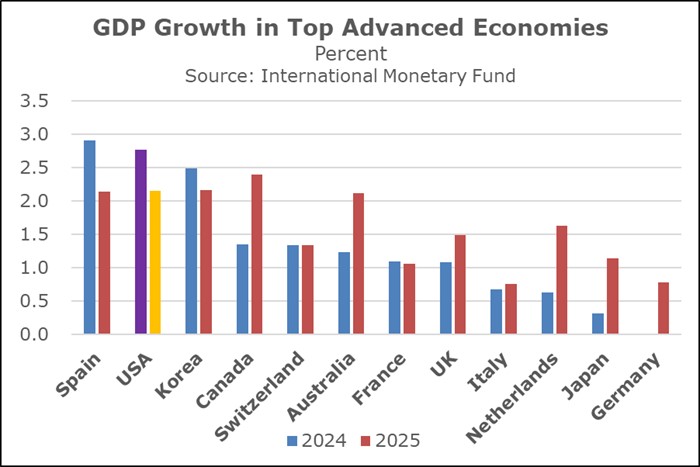
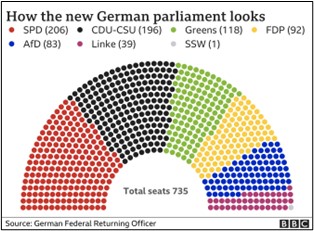
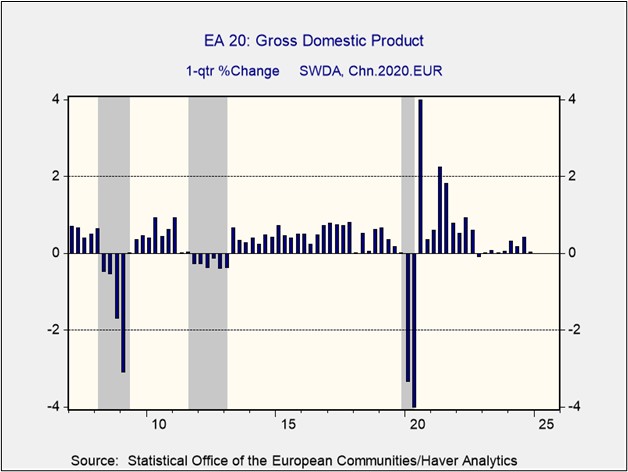
We exited international developed equities in all strategies this quarter and remain uninvested in emerging markets. Economic growth has been slowing due to productivity declines, persistent inflation, political tensions, and aging demographics. Additionally, we expect the dollar to remain strong due to its reserve currency role and the safe-haven appeal of US markets. A strong dollar often attracts global investors to US assets, leading to capital outflows from foreign economies, which can weaken their currencies and financial systems. Notably, the potential economic effects of evolving US trade policy have changed the risk calculation for foreign markets. Although current foreign equity valuations remain low, we believe the heightened risks have extended the time frame for valuation normalization.
BOND MARKET OUTLOOK
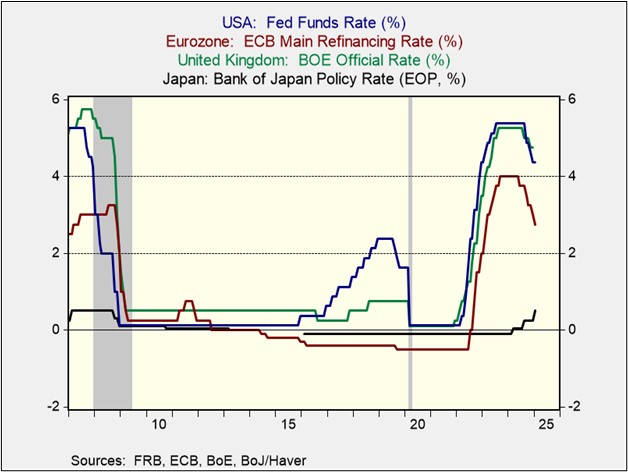
Counter to our view last quarter that the yield curve would return to a normal positive slope over a period of several quarters, market reactions after the December rate cut returned the Treasury yield curve to a normal positive slope within days. The current shape of the curve now rewards savers with a real rate of return above inflation. Although we still expect inflation volatility to remain elevated over the next three years with consequent effects on yields, we expect the general direction of rates to decline, albeit unevenly, providing a favorable backdrop for bonds. Nevertheless, with trade policies being uncertain, and even mercurial, we anticipate that the Fed is unlikely to achieve its 2% target inflation level. Rather, in our view, CPI-U will probably settle in a range closer to 3%, with a corresponding decline in the fed funds rate over the next two years accompanied by the conclusion of the Fed’s quantitative tightening program involving a reduction in the balance sheet, potentially in the near term. Given our expected rate trajectory over the forecast period, we extended duration in the strategies that have an income component, albeit modestly.
Among sectors, we view Treasurys and mortgage-backed securities (MBS) favorably. The MBS overweight in most strategies is due to the major refinance wave by homeowners during the ultra-low rates experienced in COVID, which has led to a suppression of prepayment speeds. We believe low rates on existing mortgages will limit both duration extension and outsized interest rate risk should rates climb. On the other hand, the deeply discounted prices of seasoned MBS provide upside in the event that rates decline and drive prepayments higher. Conversely, we have a restrained view on investment-grade corporates given the historically tight spreads to Treasurys. Although companies were able to refinance debt at favorable terms several years ago, leading to a dampening of new supply, the tight spreads hold little allure relative to Treasurys and MBS. Speculative grade bonds, however, are trading at option-adjusted spreads of 260+. Though narrow by historical standards, the absence of a recession in our forecast encourages the continued use of speculative grade bonds but with a concentration on the higher-rated BB credits.
OTHER MARKETS
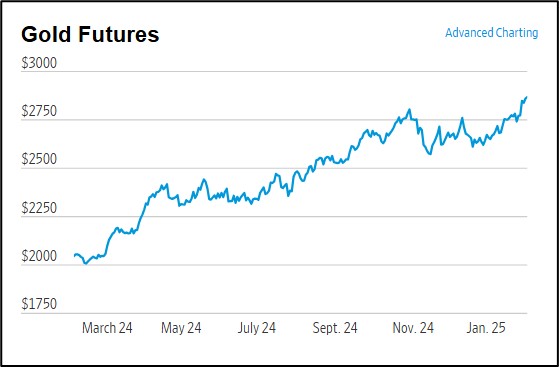
We maintain our position in gold across all strategies for its role as a time-tested hedge against geopolitical uncertainty and market volatility. Gold’s historical status as a safe-haven asset, coupled with continued central bank demand, supports its long-term value potential. In contrast, we exited our silver position this quarter as other asset classes present more compelling risk-adjusted opportunities. While improved REIT valuations and potential interest rate declines are positive factors, concerns over debt refinancing challenges and uncertain property valuations prompt us to remain cautious on the sector.
Read the full report
Asset Allocation Fact Sheet