

Author: Amanda Ahne
Daily Comment (April 11, 2025)
by Patrick Fearon-Hernandez, CFA, and Thomas Wash
[Posted: 9:30 AM ET] | PDF
Good morning! Markets are closely tracking the latest trade developments. In sports, Alex Ovechkin has cemented his legacy as the NHL’s all-time leading goal scorer. Today’s Comment will explore why the bond market continues to shrug off inflation data, provide an update on the Trump tax bill, and discuss the EU’s escalating regulatory push against Big Tech. We’ll also cover other market-moving news and, as always, provide a roundup of key international and domestic data releases.
Bond Market Turmoil: In a telling sign of shifting market priorities, bond investors largely dismissed the better-than-expected inflation data.
- The Consumer Price Index (CPI) fell in March for the first time in nearly five years, suggesting that recent tariffs have not yet translated into higher consumer prices. The index dipped 0.1% month-over-month, defying economists’ expectations of a 0.1% increase. Even the core CPI, which excludes volatile food and energy costs, inched up just 0.1%, well below the projected 0.3% rise. The moderation in inflation was driven largely by falling gasoline and used car prices.
- While the slowdown in the CPI report was welcomed, the exact drivers of the decline remain unclear. Weak demand — likely tied to broader economic concerns — appears to have weighed heavily on gasoline prices and airline fares, which fell 6.3% and 5.3%, respectively. Meanwhile, shelter cost, the index’s largest component, grew at its slowest pace since June of last year. The moderation in shelter costs suggests that the post-pandemic price distortions are gradually working their way through the economy.
- While cooling inflation has traditionally been welcomed by markets, investors are growing increasingly concerned about persistent price pressures due to tariffs. Retailers are now warning of potential price hikes as rising costs and lower inventories squeeze margins. These increases could emerge across various sectors, from imported fruits (with the US importing roughly 65% of its supply) to bicycles (which rely heavily on foreign components).
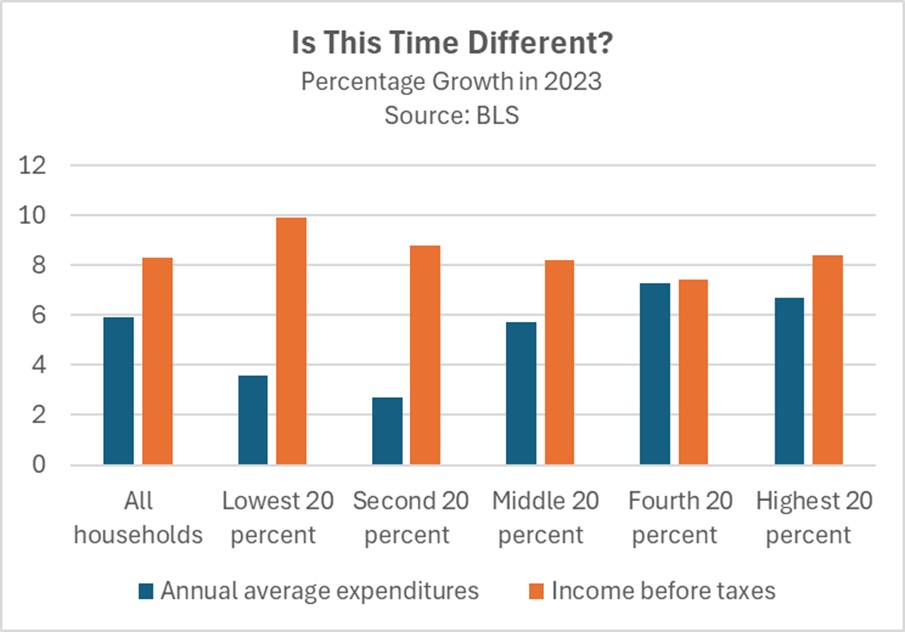
- Corporations appear to be ready to test their pricing power, with firms passing input costs on to consumers. While this worked early in the business cycle, it is unclear if it will be effective in the current environment. Lower-income households, while initially protected by pandemic-era savings and wage growth, now face diminishing financial cushions. Simultaneously, equity market declines threaten to suppress consumption via the wealth effect among affluent demographics. As a result, firms may face resistance.
- While stagflation cannot be ruled out entirely, it’s important to note this phenomenon typically occurs during severe energy shocks. In fact, before the 1970s, most economists considered stagflation theoretically impossible. That said, given the unexpected resilience of households in weathering inflation so far, we can’t dismiss the possibility completely. Currently, the bond market appears to be establishing a new equilibrium, a process that may temporarily impair its traditional role as an economic indicator.
Fiscal Deficit Widens: As Republicans move closer to passing tax cuts, growing concerns emerge that investors may become wary of holding debt due to the rising deficit and uncertainty about future economic growth.
- House Republicans advanced their budget blueprint, 216-214, targeting extensions of Trump-era tax cuts and deeper spending reductions. The close vote, which relied on almost complete GOP support, revealed the party’s narrow majority. Lawmakers touted potential long-term savings of $1.5 trillion, but the bill only specifies $4 billion in cuts over the next decade, demonstrating a substantial discrepancy between their stated fiscal goals and the immediate impact of the legislation.
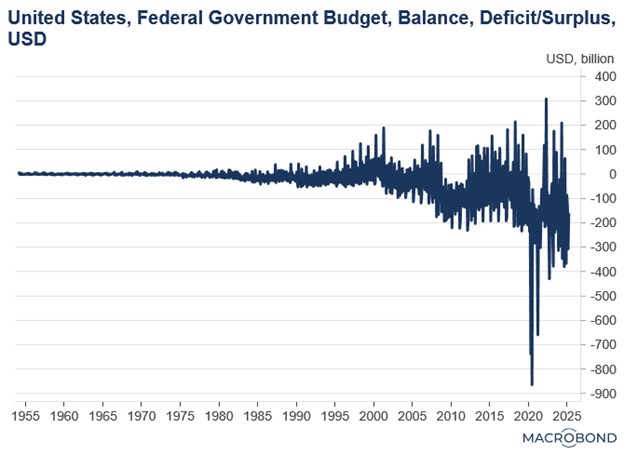
- Despite some fluctuations, the US deficit remains a significant concern. The federal government reported a $1.307 trillion shortfall for the first half of the fiscal year (October-March), marking the second-largest six-month deficit on record. This figure is close to the unprecedented $1.706 trillion deficit seen during the same period in 2021, when pandemic-related expenditures were at their highest.
- Luckily, investor appetite for long-term bonds in the primary market remains resilient in the face of headwinds. Thursday’s $22 billion, 30-year Treasury auction saw robust demand, with the debt clearing at 4.435%, below the expected yield at the bid deadline. This strong showing follows Wednesday’s solid 10-year Treasury auction, suggesting investor concerns about tariffs dampening demand for US debt may be overstated.
- While concerns persist about the recent rise in 10-year Treasury yields, there are no clear indicators this represents a crisis. The upward movement appears primarily driven by investors raising cash through position liquidations, though market speculation points to possible foreign central bank selling — the People’s Bank of China being the most probable candidate. Should this yield momentum continue, Federal Reserve intervention may become increasingly likely.
EU Prepares for US Talks: The EU is prepared to protect its interests as it seeks to meet the US halfway in some of its demands.
- European Commission President Ursula von der Leyen is set to negotiate with the US during a 90-day window. However, she has warned that the EU is prepared to walk away if talks are not conducted in good faith and potentially retaliate by targeting US trade in services, specifically tech firms, with digital taxes. Her threat follows US efforts to address the EU trade imbalance and scrutinize its tax policies.
- Her remarks follow the Trump administration’s criticism of the EU, targeting not only its trade surplus with the US but also its defense spending, tax policies, and regulatory framework. While the European Union has shown a willingness to discuss military expenditure and trade issues, it has remained silent on addressing other American concerns such as getting rid of VAT or loosening tech regulation.
- The current standoff between the US and EU will likely center on establishing a mutually beneficial framework for cooperation. The most probable outcome would involve creating an economic ecosystem that simultaneously limits China’s influence while advancing Western technological ambitions. Given these strategic imperatives, we believe negotiations could still foster closer transatlantic ties, provided both sides demonstrate a willingness to make concessions for a meaningful agreement.
End to Tariff Madness? China has retaliated against the US decision to impose 145% tariffs on its goods by introducing 125% tariffs on American products. However, Beijing has indicated it does not intend to escalate tariffs further.
- China’s move to raise tariffs on US goods signals its readiness to withstand a prolonged trade conflict with Washington. While Beijing has pledged to avoid further tit-for-tat measures, it has firmly stated it will not back down. These tensions underscore the accelerating economic decoupling between the world’s two largest economies.
- These escalating tariffs have now reached levels that make cross-border commerce commercially unviable for many firms. This development threatens corporate earnings in both nations, as US companies have depended on China’s rapidly growing consumer market for overseas profits, while Chinese firms have relied on access to America’s massive consumer base.
Daily Comment (April 10, 2025)
by Patrick Fearon-Hernandez, CFA, and Thomas Wash
[Posted: 9:30 AM ET] | PDF
Good morning! Markets are digesting the latest inflation figures while Lionel Messi’s double-strike propelled Inter Miami past LAFC into the CONCACAF semifinals. Today’s Comment will focus on President Trump’s decision to roll back tariffs, insights from the latest Fed minutes, and other major market-moving news. As always, we’ll include comprehensive summaries of today’s domestic and international economic releases.
Trump Reversal: US stocks experienced a rally following the administration’s tariff reductions on most nations, excluding China, which saw an increase to 125%. Despite the market’s positive initial response, persistent uncertainty remains.
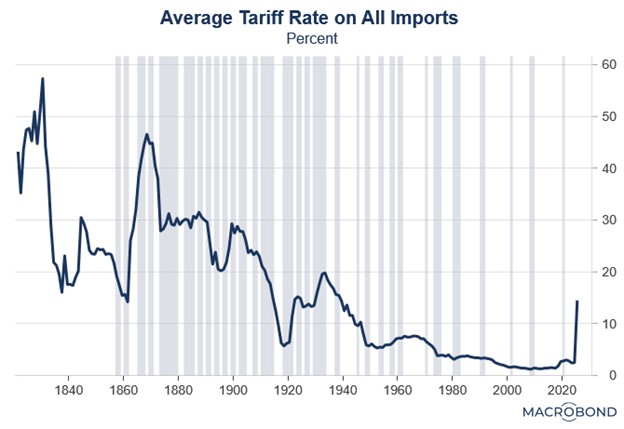
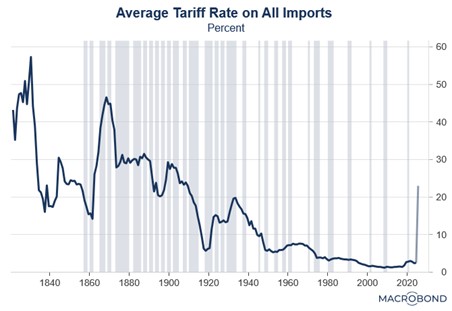
- The US agreed to postpone new tariffs for 90 days while pursuing trade negotiations with partner nations. Markets responded positively to the decision, where the average tariff rate would fall from 23% to 10% — a development that alleviated concerns about supply chain instability and potential economic contraction. The policy shift triggered a significant market rally, sending the S&P 500 up 9.5% and propelling each “Magnificent 7” stock to gains exceeding 10%.
- While markets welcomed the policy reversal, uncertainty persists over the trade war’s trajectory. The president’s baseline tariffs remain in effect, pushing the average import tax rate for non-China trade partners to 15.7%. This includes the 25% tariffs still applied to Canadian and Mexican goods not covered by USMCA provisions. According to White House data, only 38% of Canadian imports and 50% of Mexican imports currently comply with the agreement’s standards.
- It seems that the administration is seeking to condition markets to become less reactive to tariff announcements. The current pause may serve two key purposes by demonstrating presidential flexibility while also normalizing the recently imposed 10% tariffs as a sustainable baseline. This calculated approach should help stabilize markets as the price impact of these import taxes gradually filters through the economy. A major unknown is how consumers will respond to the eventual price shock.
Trade Friends Not Enemies: While the White House has shown limited interest in bringing down newly implemented tariff rates, it does seek to use trade tensions to form an alliance against China.
- The US decision to pause the increase in tariffs has been widely viewed as a step in the right direction, though questions remain about how far the White House is willing to go in implementing reciprocal tariffs. Kevin Hassett, one of the White House’s economic advisors, suggested potential tariff rates below 10% might be possible, though he cautioned this would require an “extraordinary” trade deal to justify such reductions.
- While this decision has provided some market reassurance, uncertainty persists regarding whether other nations will refrain from retaliatory measures. The EU has agreed to delay its metal tariffs by 90 days, and while Canadian Prime Minister Mark Carney welcomed the announcement, Canada has not yet committed to any tariff relief.
- China is bracing for tariff fallout, with leaders meeting today to discuss stimulus measures. The package will target housing, consumer spending, and tech innovation to protect growth. Since growth has slowed in China, speculation has swirled about Beijing deploying its “stimulus bazooka,” large-scale measures to revive an economy facing prolonged sluggish growth.
- Treasury Secretary Scott Bessent hinted that the White House may pursue a collective approach with allies to coordinate their approach toward China. His remarks seem to reflect a long history of the US trying to coalesce its allies into joining its efforts to isolate China. It also comes as Spain has been urging the EU to deepen economic ties with Beijing, aiming to reduce reliance on the United States.
- Markets may be underestimating the psychological strategy at play. By first imposing 10% tariffs and then escalating to far higher levels, the initial increase appears modest by comparison. The use of “reciprocal tariffs” was designed to encourage global tariff reductions in exchange for US concessions. Yet, America’s traditionally low tariffs offered little bargaining power.
- The updated tariff framework strengthens Washington’s leverage, pressuring allies to align their trade policies with its China strategy. Notably, US tariffs on Chinese goods are now so high that they will likely redirect Chinese exports away from the US and toward Europe — further fueling protectionist sentiment on the Continent. Ultimately, this policy may reinforce Europe’s perception that it must collaborate with the US to counter China.
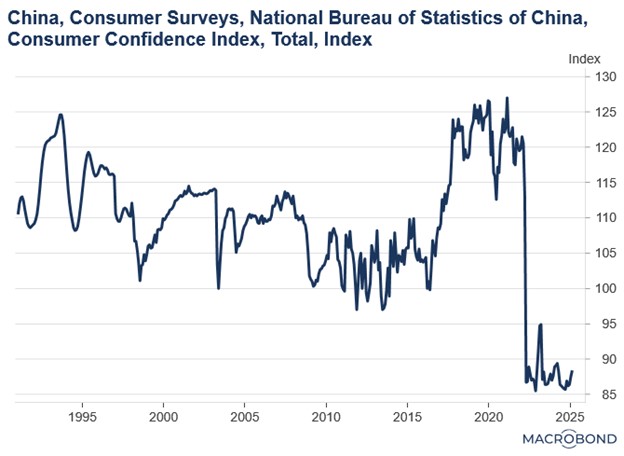
- The key unknown is the size and scope of China’s stimulus measures. A substantial spending package could help restore consumer confidence, which has remained weak since the pandemic. It could also boost domestic demand, reducing the economy’s reliance on foreign consumption of its goods.
Fed Stagflation Worries: Fed minutes showed officials’ fears about stagflation, while balance sheet reduction faced strong opposition despite broad support.
- Nearly all FOMC members expressed concerns that inflation risks remain skewed to the upside, while employment risks also appear elevated. This outlook will likely compel policymakers to adopt a cautious, wait-and-see approach when adjusting monetary policy. These concerns arise as central bankers wrestle with the potential economic fallout from the Trump administration’s trade war.
- Despite the Fed’s reluctance to commit to rate cuts amid ongoing uncertainty, markets are still pricing in three potential rate cuts this year, exceeding the two projected in the Fed’s latest economic outlook. This divergence suggests investors see elevated recession risks due to the ongoing trade war, which therefore keeps expectations for further monetary easing alive.
- Regarding the balance sheet, policymakers appear divided on whether the reduced pace of unwinding was appropriate. The decision stemmed from concerns about preserving sufficient reserve buffers after Congress suspended the debt ceiling. Since January, Treasury’s drawdown of its General Account (TGA) to fund government operations — while Congress negotiated the debt limit — has created distortions in reserve markets, as these flows directly impact liquidity in the commercial banking sector.

- While Fed Governor Christopher Waller was the only dissent, several others pushed to maintain the original pace of balance sheet unwinding. Their reluctance was due to concerns that it could compromise the Fed’s balance sheet normalization efforts. They believed alternative tools would have been sufficient to address reserve concerns. Specifically, an adjustment to the reverse repo facility rate could have provided an effective alternative, injecting needed liquidity to prevent a problem.
- Thus far, market impacts appear contained despite elevated uncertainty. While recent bond market volatility reflects trade war concerns, Cleveland Fed President Beth Hammack noted that while financial markets are under strain, they continue to function effectively. That said, we should emphasize that the Fed stands ready to intervene if necessary — either through balance sheet expansion to address liquidity shortages or by cutting the federal funds rate to mitigate solvency risks.
Chinese Troops in Ukraine: Two Chinese nationals were caught fighting for the Russian army, in a sign that the war may be broadening.
- Ukrainian officials have accused China of not taking sufficient measures to stop its citizens from enlisting in the Russian military, with estimates suggesting up to 150 Chinese fighters may be involved. If confirmed, this would represent the strongest indication yet of Chinese support for Russia’s invasion and will likely call into question the country’s claim of being neutral in the war. Following the allegation, the White House threatened to take action.
- The discovery of Chinese military involvement is poised to significantly escalate US-China tensions, particularly as Washington seeks to broker an end to the war in Ukraine. This support could substantially strengthen Russia’s negotiating position by demonstrating its capacity to prolong the conflict with Beijing’s backing. Moreover, it serves as stark evidence that American attempts to isolate Moscow and draw it away from Chinese influence may ultimately prove unsuccessful.
- A critical unknown remains how the EU will respond to these developments. Over the last few years, the bloc has repeatedly urged China to intervene and restrain Russia’s aggression in Ukraine. European leaders have even cautioned that Beijing’s support for Moscow risks triggering a fundamental divergence in their bilateral relations.
Daily Comment (April 9, 2025)
by Patrick Fearon-Hernandez, CFA, and Thomas Wash
[Posted: 9:30 AM ET] | PDF
Good morning! The markets remain laser-focused on developments in the escalating trade war. In sports news, Arsenal secured a decisive 3-0 victory over Real Madrid in last night’s Champions League showdown. Today’s Comment will examine the growing anxiety in bond markets, the latest updates on tariff implementations, and other key market-moving events. As always, we’ll conclude with our comprehensive roundup of both domestic and international economic data releases.
Bond Market Sell-Off: Investors are growing increasingly apprehensive as the trade war escalates, sparking a sell-off in Treasurys.
- The first day of the increased tariff implementation triggered a sell-off in global bond markets as investors retreated to the sidelines amid escalating uncertainty. Bond prices plummeted while yields surged, reflecting a rush to liquidate holdings as trade war tensions intensified. Despite these liquidity concerns, the US dollar has not strengthened — a potential sign that investors are diversifying their currency exposures.
- A recent Treasury auction has also raised fresh concerns about the growing federal deficit. Tuesday’s three-year note sale drew unexpectedly weak demand, signaling investor reluctance to increase their holdings of government debt. The lackluster performance suggests market participants may be preparing to reduce their Treasury exposure if economic conditions deteriorate in coming weeks.
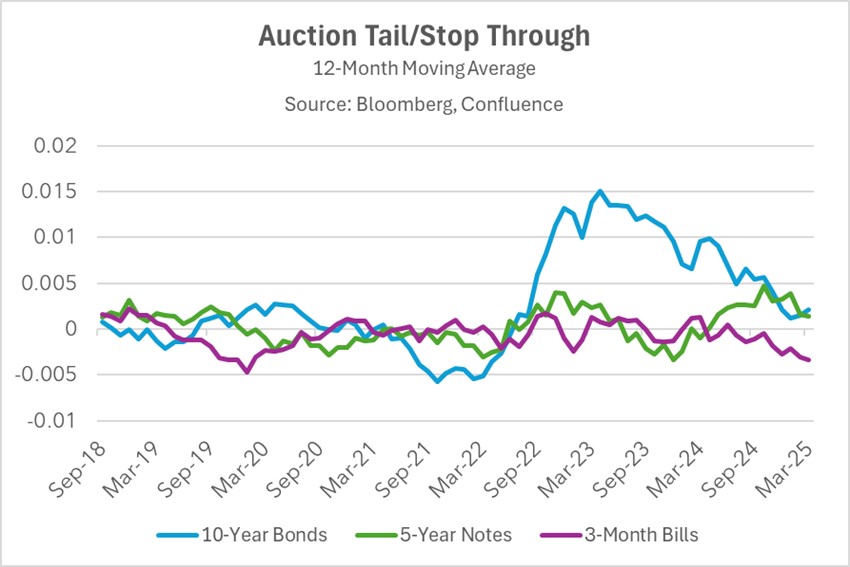
- Recent bond market activity indicates declining appetite among US debt investors for medium-to-long term duration exposure. As illustrated in the chart above, tail and stop auction levels, which reflect where yields settled relative to market expectations, confirm this trend. The Treasury’s shift toward shorter-term issuance has enhanced liquidity in long-dated securities, though at the cost of reduced demand for intermediate maturities. Meanwhile, Treasury bills continue to demonstrate robust investor interest.
- Growing concerns about bond market liquidity could force the Federal Reserve to stop quantitative tightening earlier than they planned, and possibly even start buying bonds again. While lowering interest rates is still a possibility, the Fed would likely only do that if there were serious solvency risks, such as companies being in danger of not being able to pay their debts. Right now, it doesn’t look like we’re facing that kind of problem.
Dealing With Tariffs: Amid rising economic headwinds, foreign policymakers are implementing targeted relief measures to protect vulnerable sectors and maintain stability — while also seeking a deal with the US.
- While China has raised tariffs on US goods to 84%, it has also signaled its readiness to hold talks with the US. This comes after President Trump imposed tariffs of up to 104% on Chinese goods. Meanwhile, the People’s Bank of China has sought to cushion the impact by devaluing its currency, aiming to preserve competitiveness in the ongoing trade war.
- The European Union, having retaliated with tariffs against the US, now faces growing calls to counter US trade measures by lowering its own duties and pivoting toward China. Two ECB policymakers have already endorsed rate cuts at the upcoming meeting to cushion the economic blow from rising US tariffs. Meanwhile, Spanish Prime Minister Pedro Sánchez is urging the EU to deepen trade relations with China, aiming to reduce dependence on the US market.
- In Southeast Asia, countries are taking steps to mitigate the economic fallout by rolling out stimulus measures. Taiwan has activated its stabilization fund to shore up local equity markets following a sharp sell-off. Meanwhile, South Korea has announced a $2 billion aid package to bolster its auto industry. Elsewhere, Japan has established a task force to address the tariff dispute, with speculation mounting that it may consider an emergency budget.
- As the new tariffs take effect, signs of diplomatic progress are emerging. The US continues negotiations with trade partners to potentially reduce these measures, with several key developments: Vietnam has agreed to reduce its trade balance by purchasing more US arms, South Korea anticipates finalizing a significant trade agreement imminently, and Japan appears to be receiving preferential attention in ongoing trade discussions.
Big, Beautiful, Bill in Jeopardy? Republican lawmakers are increasingly hesitant to back the president’s tax bill, voicing concerns over its fiscal impact and doubting its revenue potential amid ongoing trade tensions.
- Several House Republicans opposed the president’s signature tax bill on Tuesday, raising objections to its hefty price tag. The dissenters are now threatening to block a key procedural vote needed to advance the legislation — a move that could stall the bill indefinitely. The resistance comes just hours after a high stakes meeting between GOP lawmakers, the president, and House Majority Leader Mike Johnson failed to resolve the spending dispute.
- The growing trade conflict has strengthened Republican opposition to the spending bill, as lawmakers express doubts about its ability to generate sufficient revenue to offset its costs. While the White House projects $600 billion in annual tariff revenue, economists caution that elevated rates could decrease trade volumes, thereby jeopardizing revenue targets. In an attempt to alleviate concerns, the president has set a goal of $1 trillion in spending cuts.
- While we expect Republicans will ultimately pass the tax bill, we question their ability to identify spending cuts substantial enough to reassure markets. This fiscal constraint may force lawmakers to consider revenue-raising alternatives, including potential tax increases on high-income households, as they prioritize preserving middle-class tax relief.
Coal on the Rise: President Trump signed an executive order to boost the production of coal with hopes that it can be used to fuel AI.
- The new executive order aims to roll back industry regulations that have contributed to coal’s persistent production decline. Through emergency measures, the president has authorized the Department of Energy to intervene in sustaining coal operations. The administration further underscored coal’s strategic value by classifying it as a “critical mineral,” a designation that directly links its production to national security.
- This move is expected to advance President Trump’s ambition to establish the US as a global AI leader. This comes as the president has sought to make the US the center of innovation for AI with his Stargate Project in which the US plans to invest $100 billion on co-located data centers, which would allow them to be built next to their energy source.
- Surging demand for data centers and semiconductor production has reversed years of stagnant electricity consumption in the US, triggering the first sustained increase in over a decade. This trend could drive up utility bills industry-wide while creating inflationary pressure on housing costs.
Daily Comment (April 8, 2025)
by Patrick Fearon-Hernandez, CFA, and Thomas Wash
[Posted: 9:30 AM ET] | PDF
Our Comment today opens with some new observations on the global financial markets as they respond to President Trump’s new US tariff regime. We next review several other international and US developments with the potential to affect the financial markets today, including reports of a new Ukrainian incursion into Russia and another firing of a high-level US military officer as part of what appears to be a broad purge of officials.
Global Financial Markets: By market close yesterday, US stock prices were relatively little changed. However, intraday trading was just about as volatile as yesterday’s action in Asia and Europe. Stocks were whipsawed by a false report that President Trump would pause his reciprocal tariffs for 90 days and by news that he threatened an added 50% tariff on Chinese goods if Beijing doesn’t lift its retaliatory tariff of 34% on US goods by Tuesday. Amid this volatility, we think investors and their advisors should keep in mind the following key points:
- While it is tempting to tag all this volatility on Trump’s tariffs, the problem is broader. As we’ve written for years, the global order is in the process of changing as the US reconsiders its role as the global hegemon. Even if Trump froze or rescinded his tariffs today, that process would likely continue, and the result would likely be further economic disruption and market chaos.
- The administration’s mixed messages and shifting strategies also are likely to prolong the uncertainty. After all, even if Trump decided to pause or rescind some or all of the tariffs, businesses and investors now have probably been trained not to trust him. As with those of us who live in Missouri, their attitude might well be, “Show me” before they let down their guard and start making normal long-term decisions again.
- It’s also important to remember that the epicenter of the trade war is China. In response to Trump’s threat to impose an additional 50% tariff on China, the country’s commerce minister today said, “If the US insists on its own way, China will fight to the end . . . China will resolutely take countermeasures to safeguard its own rights and interests.” We judge that the Chinese leaders should be taken at their word on this, which suggests a prolonged US-China trade war.
- The ebb and flow of statements and potential tariff adjustments will certainly spark some rallies in the markets. Indeed, Japanese and US stocks today are rebounding on signs from the White House that it is open to negotiations. Given the discussion above, we think investors should be skeptical that a long-lasting rebound can be established so easily.
- Investment strategy should therefore make full use of the various tools available to manage risk, from proper diversification to meaningful positions in safe-haven assets such as US Treasury obligations, defensive blue-chip stocks, and gold. Such tools may not protect against all losses, but they are likely to help reduce gut-wrenching volatility.
- At the same time, our geopolitical, economic, and financial market analysis teaches us that today’s global transition and the Trump administration’s specific tariff policies have created big, long-lasting trends that are likely to be investable. For example, we have long championed high quality, dividend paying value stocks. Our Asset Allocation programs have also taken positions in European defense stocks. We continue to look for new opportunities amid the current market volatility.
- While investors may be tempted to sell their risk assets in times like these, it’s important to remember that such a strategy is very hard to pull off as it requires being right about both the time to sell and the time to get back into the market to take advantage of any rebound. Because that’s so difficult, the better approach for many investors is probably to ride out the storm and resist panic selling.
- Finally, while we might quibble with whether Trump really needed to impose his tariffs and other radical economic policies so abruptly and idiosyncratically — rather than telescoped beforehand and implemented step-by-step over time — we can appreciate the effort to address the US’s longstanding trade deficits, budget deficits, and debt. Even if Trump’s approach has created a lot of uncomfortable volatility and raised the risk of recession, the policies may well prove positive in the longer term. Time will tell.
China: State-owned investment fund Central Huijin yesterday afternoon confirmed that it had bought Chinese “A” shares to support the domestic stock market amid a rout sparked by the new US tariffs on China. The market intervention highlights the policy tools that Beijing is likely to roll out to protect the Chinese economy from the new tariffs. Other potential measures include interest rate cuts, a devaluation of the renminbi, and increased fiscal spending.
Turkey: In an interview with the Financial Times, Finance Minister Mehmet Şimşek said the global economic and market turmoil around the new US tariffs could actually be positive for his country. According to Şimşek, falling energy prices would help reduce Turkey’s current account deficit and help the country rebuild its foreign reserves. It would also help bring down consumer price inflation. The statement is a reminder that some well-placed countries could well see their geopolitical or economic positions enhanced in the new environment.
Russia-Ukraine War: Ukrainian President Zelensky today confirmed for the first time that Kyiv’s forces are now fighting in the Belgorod region of Russia, marking a second incursion after Ukrainian troops seized part of the Kursk region last summer. Even though the current US-brokered deal to stop attacking each other’s energy infrastructure is faltering, the new Ukrainian incursion is probably designed at least in part to be leverage in any broader peace negotiations between Moscow and Kyiv.
Canada: In its first-quarter business outlook report yesterday, the Bank of Canada said 32% of surveyed businesses indicated they are now planning for a recession in the coming year, up from an average of just 15% in the last two quarters of 2024. The figures confirm other reports suggesting the Canadian economy is already slipping into a contraction in response to the new US tariffs on Canadian goods.
United States-China-Panama: US financial firm BlackRock’s deal with Hong Kong-based CK Hutchison to acquire dozens of ports around the world, including key ports at either end of the Panama Canal, now appears to be in trouble after a Panamanian official said Hutchison owes $300 million to Panama and violated some Panamanian regulations. If the deal is scuttled, it would likely further fray US-China relations, which had been unexpectedly calm over the first two months of President Trump’s administration.
- The BlackRock-Hutchison deal had been pushed by Trump to reduce Chinese influence over the Panama Canal, but General Secretary Xi was reportedly angry about it when he eventually got wind of it.
- Because of Xi’s opposition, it would not be a surprise if covert Chinese influence was behind the wrench being thrown into the deal. At this point, however, it isn’t entirely clear whether the agreement will be killed definitively.
United States-Iran: Yesterday, the US and Iran said they will begin negotiations over Tehran’s nuclear program. However, the statements were contradictory, with President Trump saying the talks would take place directly between US and Iranian officials and the Iranians saying the talks would only be indirect through intermediaries.
- If the talks take place and are successful, the eventual result could be an end to US sanctions on Iran and more Iranian oil freely trading on global markets.
- If the talks fail, the chance of a US-Israeli attack on Iran would increase. Any such attack would likely be highly disruptive to the global economy and energy supplies.
US Military: Reports yesterday said Vice Admiral Shoshana Chatfield, the US representative to the North Atlantic Treaty Organization’s military committee, has been abruptly fired. That makes Chatfield one of about a dozen top military and national security officials fired after a meeting last week between President Trump and right-wing conspiracy theorist Laura Loomer. The firings have raised questions about who controls or influences top US national security officials and how the administration is managing US national defense.
- Chatfield was previously the first woman to head the US Naval War College in Newport, Rhode Island. While she headed the college, she was accused by conservative groups of being overly concerned with diversity, equity, and inclusion initiatives.
- Other officials recently purged include the head of the National Security Agency and several staff members of the National Security Council who Loomer reportedly accused of being disloyal to Trump.
US Fiscal Policy: The Centers for Medicare and Medicaid Services yesterday said it will provide a 5.06% hike in the rate at which it pays health insurers participating in the Medicare Advantage program. The increase, which takes place in 2026, is more than double the 2.23% hike proposed by the Biden administration in January. Since the new figure signals the Trump administration will be unexpectedly supportive of Medicare Advantage, the news will likely give a boost to health insurers’ stocks today.
US Tax Policy: A Bloomberg report yesterday said the Trump administration is mulling a potential exporter tax credit to help firms damaged by other countries’ retaliatory tariffs on US goods and services. Administration officials remain divided on the idea, which in any case would require Congressional approval.
Bi-Weekly Geopolitical Report – Growing Fragility in the US Bloc (April 7, 2025)
by Patrick Fearon-Hernandez, CFA | PDF
We at Confluence have written extensively on the end of post-Cold War globalization and the fracturing of the world into various geopolitical and economic blocs. We’ve noted that the large, rich bloc led by the United States is an attractive place for investors, but fractured supply chains and rising international tensions may produce a range of economic and financial market problems, from elevated consumer price inflation to higher and more volatile interest rates. In this report, we explore what could happen to the US bloc as President Trump pursues his aggressive policies to push the costs of Western security and prosperity onto the US’s traditional allies. As we’ve noted before, those policies run the risk of reducing US influence with its allies and undermining cohesion within the US bloc. We assess in this report that reduced cohesion probably won’t splinter the US bloc in the near term. Nevertheless, we begin laying out how the world could change if the US bloc does disintegrate, and we discuss the economic and market implications if it does.
Don’t miss our accompanying podcasts, available on our website and most podcast platforms: Apple | Spotify
Bi-Weekly Geopolitical Podcast – #64 “Growing Fragility in the US Bloc” (Posted 4/7/25)
Daily Comment (April 7, 2025)
by Patrick Fearon-Hernandez, CFA, and Thomas Wash
[Posted: 9:30 AM ET] | PDF
Our Comment today opens with the very latest on the Trump administration’s new tariff policies. We next review several other international and US developments with the potential to affect the financial markets today, including potential policy responses to the tariffs from countries such Japan and Germany, and news that the administration is considering a massive cut in the US Army’s active-duty troop count.
US Tariff Policy: President Trump’s baseline 10% tariff on most US imports went into effect over the weekend, and Treasury Secretary Bessent and Commerce Secretary Lutnick said in press interviews that the additional “reciprocal” tariffs on dozens of countries will start as planned on Wednesday. They also warned that even if foreign countries offer concessions to reduce their tariff rates, any negotiations will take time, and the maximum tariffs would be in place until then.
- Bessent also downplayed the drop in the value of risk assets because of last week’s tariff announcement, saying, “Americans who want to retire right now, Americans who have put away for years in their savings accounts, I think they don’t look at the day-to-day fluctuations of what’s happening.”
- Bessent’s statement is further evidence that the administration intends to stick by its economic policies even if economic activity weakens or risk assets continue to lose value. That raises a risk that any needed course correction may not come until it’s too late to avoid a recession or an even steeper market downturn.
- In a continuing response to the tariffs, stock prices in Asia and Europe plunged overnight, and US stock futures are signaling another sharp drop at market open. Oil prices also continue their sharp drop, while investors are bidding up bonds, which is driving down yields.
- Just as concerning, we have noted that gold, cryptocurrencies, European defense stocks, and other assets that had recently been appreciating are now turning downward as well. That suggests that at least some investors are now facing margin calls and are selling what they can, not what they want to. That creates a risk of the financial markets entering into a self-reinforcing downward spiral that causes lasting economic damage.
- Of course, US investors have a very high level of cash “on the sidelines” in money market funds, which could theoretically be used to buy stocks once they look like a good value. However, the administration’s promise to stay the course with its aggressive policies and its past backtracking have created so much uncertainty that investors may be unusually wary about buying the market’s current decline.
Eurozone: Greek central bank chief Yannis Stournaras, who sits on the policymaking board of the European Central Bank, warned in an interview today that the Trump administration’s new tariffs would create an unexpected demand shock for the eurozone, potentially pushing down consumer price inflation below the ECB’s target. The statement signals that some of the region’s policymakers may want to keep cutting interest rates at the ECB’s policy meeting next week, despite ECB President Lagarde’s recent hints of a pause in rate cuts.
Germany: Friedrich Merz, who is negotiating to form the country’s next government and is likely to become its chancellor, warned today that the economic and financial market turbulence from the US’s new tariffs mean that Germany must regain economic competitiveness as quickly as possible. Indeed, Merz said that strategies to deal with the US tariffs will now be a key focus for his center-right CDU party and the center-left SPD as they continue talks to form a coalition. That raises the prospect for big economic reforms in Germany once the government is formed.
United Kingdom: According to lender Halifax, the average price of a home in March was up just 2.8% year-over-year, matching the increase in the year to February but coming in short of the expected increase of 3.5%. On a month-over-month basis, UK home prices fell in each of the last two months, adding to the evidence that the rapid home price appreciation of 2024 has come to an end.
Japan: With the Japanese economy facing both brutal import tariffs in the US and fast-rising prices for food and other basics at home, some politicians in the ruling Liberal Democratic Party are pushing for a cut in the country’s consumption tax. Top LDP leaders are still reluctant to go that far, fearing wider budget deficits and increased debt, but rank-and-file party members are pushing to put such a tax cut in the LDP’s platform for this summer’s Upper House elections.
- The rising calls for consumption tax cuts in Japan illustrate how countries around the world will feel pressure for stimulus programs as their exports run up against the Trump administration’s new tariffs.
- As the debate in Japan shows, any such stimulus programs could lead to bigger fiscal problems and exacerbate the economic disruptions from the new US trade policies.
- Separately, press reports say Chinese officials are also mulling significant economic stimulus measures, including a devaluation of the renminbi, to cushion the blow of the tariffs.
European Union-United States: European Commission Vice-President Séjourné today hinted in an interview that the EU won’t put tariffs on US bourbon as it retaliates for the Trump administration’s new imposts. That suggests that the EU executive has caved to demands from the wine and spirits industries of countries such as France, Italy, and Ireland, which feared the US would impose even higher tariffs on their products if the EU retaliated against US whiskey.
US Military: According to a report late last week, the US Army is “quietly” mulling a cut in its active-duty troop count from about 450,000 now to as little as 360,000 in the coming years. It is unknown whether any cuts are being considered for the Army Reserve or the National Guard. The contemplated cuts reflect a number of pressures, including President Trump’s directive to cut the defense budget by 8% and the administration’s plan to shift military resources away from land maneuver forces in Europe to naval and air forces in the Asia-Pacific region.
- If the US downsizes its ground forces and shifts military assets out of Europe before the Europeans can rebuild their own defense capabilities, Russia would likely be emboldened to assert itself in the region, if not by actual territorial aggression, then perhaps by political pressure.
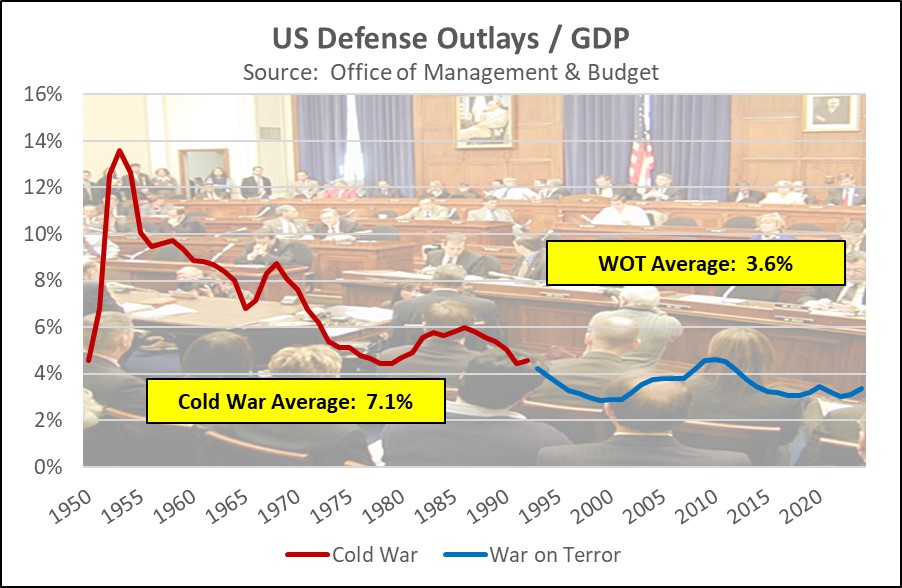
- In any case, the drive to cut defense spending comes even though the US defense burden (military outlays as a share of gross domestic product) is now at a historic low of only about 3.3%, versus an average of 3.6% during the War on Terror and 7.1% during the long Cold War.
US Agriculture Industry: A report on Friday said administration officials and congressional lawmakers are considering new fiscal support for farmers hurt by retaliatory tariffs or other trade barriers imposed by other countries in response to President Trump’s tariffs on US imports. The talks are in the early stages, so it isn’t yet clear how big any such relief program would be. Still, the news suggests that US agribusiness stocks may hold up better than expected amid the evolving global trade war.
- On a related note, new analysis shows that the recent retreat in US egg prices likely stemmed from a massive surge of imports. According to the data, February egg imports from Mexico and Turkey were about four times higher than they were in the same month one year earlier.
- As avian influenza decimated US flocks earlier this year, prompting egg shortages and driving prices higher, Mexican and Turkish producers evidently responded to the price signal by shipping more to the US, exactly as economic theory would suggest. One key question now is whether the administration’s new tariffs will push those egg imports down again, creating another fowl price experience for US egg buyers.
Daily Comment (April 4, 2025)
by Patrick Fearon-Hernandez, CFA, and Thomas Wash
[Posted: 9:30 AM ET] | PDF
Good morning! Markets are digesting the latest jobs data while reacting to new tariffs from China. In sports, Chattanooga defeated UC Irvine to win the NIT Championship. Today’s Comment will analyze whether the tariff impact will be temporary or long lasting, examine recession risks, and highlight other market moving news. As always, we’ll close with key domestic and international economic data.
The Day After! With flat tariffs set to take effect on April 5 and even more extreme tariffs to follow four days later, the market continues to assess the potential economic impact.
- President Trump has signaled a willingness to consider reducing tariffs — but only in exchange for the right deal. His remarks suggest a potential shift, marking the first indication that he may reconsider the aggressive tariffs imposed on other countries. His response appears to be a reaction to the backlash following his tariff announcement, which triggered the worst market sell-off since the COVID pandemic.
- The sell-off has intensified this morning after China announced a 34% tariff on all US goods, along with export restrictions on rare earths, a critical resource for semiconductor production and other advanced technologies.
- Despite threats of retaliation from other countries, the responses to US tariffs have been relatively muted so far. Canada imposed tariffs on US auto imports but exempted those covered under the USMCA agreement. Meanwhile, France has encouraged corporations to stop investing in the US but has not put a formal law in place.
- The muted response suggests that negotiations between the US and other nations may still be underway. While existing tariffs could remain in place — and retaliatory measures from trading partners remain possible — the US’s reluctance to escalate tensions after Canada’s retaliatory auto tariffs signals that the White House may at least be willing to tolerate limited pushback. However, China’s tariffs may be a different story.
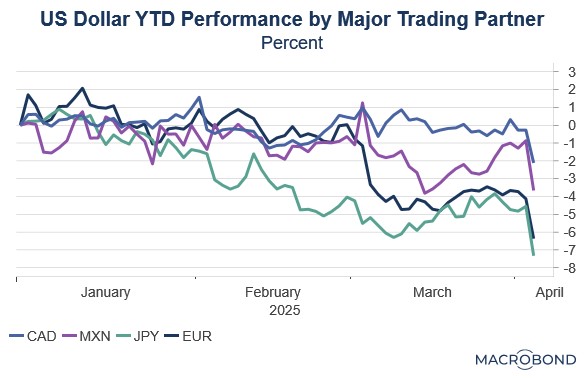
- The key question facing markets is whether these tariffs will fundamentally reshape global trade dynamics and challenge the dollar’s dominance. Yesterday’s sharp decline in the US greenback suggests investors are pricing in a scenario where the US retreats from its role as global importer of last resort. This could force trading partners to accelerate currency diversification.
The Recession Question: There are growing signs that the economy is losing momentum; however, there is still no conclusive evidence of a downturn.
- In March, the ISM Services PMI dropped from 53.5 to 50.8, signaling a potential slowdown in economic momentum. The decline was primarily driven by weakening employment conditions, as survey respondents cited growing pessimism about hiring. Notably, the prices-paid component also softened, suggesting businesses may be losing confidence in their ability to sustain pricing power.
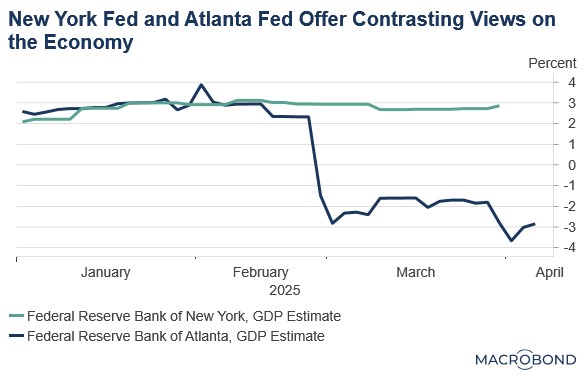
- Meanwhile, regional central banks are sending mixed signals. The Atlanta Fed’s GDPNow tracker points to a sharp slowdown in recent months, while the New York Fed’s Nowcast maintains its projection of steady growth. Markets appear to be more heavily weighting the Atlanta Fed’s model, as its real-time tracking, though more volatile, has proven more reliable than the New York Fed’s estimates in recent cycles.
- While tariffs remain a concern, markets are primarily focused on economic fundamentals. As long as data continues to show US economic expansion, a market recovery appears likely in the near term. However, should economic indicators deteriorate, the risk of a bear market would increase significantly. At this time, we still think it is a coin toss as to whether we are in midst of a downturn; therefore, we still advise investors to remain calm and patient as things play out.
Tax the Rich? Republicans may drop budget cuts and instead raise taxes on the wealthy, signaling a shift from neoliberal economics to a more populist ideology.
- Conservative lawmakers are proposing to increase the top marginal tax rate to 39.6%, reversing previous Trump-era cuts for high earners. This measure aims to offset costs while maintaining other tax reductions. The proposed revenue would fund the elimination of taxes on tips, overtime pay, and Social Security benefits, as well as the increase in the SALT deduction cap from $10,000 to $25,000.
- The move to raise taxes on top earners signals a deliberate shift by conservatives to shed their “party of the wealthy” image. Conservatives are also targeting two controversial loopholes: eliminating the carried interest tax break — long criticized for favoring private equity — and ending preferential tax treatment for sports team purchases.
- The proposed tax hike on high earners will likely face internal GOP resistance, as many members have historically pledged opposition to all tax increases. Just this year, nearly every Republican voted against measures that would limit tax cuts for the wealthy if paired with Medicaid reductions, highlighting the party’s traditional stance.
- Republican support for taxing the wealthy may be a last-ditch effort to pass their stalled tax bill. With the party divided and deficit-conscious members hesitant, this move could both satisfy fiscal conservatives and potentially draw Democratic backing. As a result, we are highly optimistic that a tax bill will be finalized over the next few weeks.
Shake Up in Defense: The president has fired several members of his National Security Council team as part of the fallout over the Signal leak.
- The decision appears to stem from Laura Loomer, a social media personality and trusted Trump confidant. She reportedly urged the president to target those responsible for leaking information to a journalist during sensitive discussions about the administration’s approach to Houthi conflicts in the Red Sea.
- Loomer’s growing influence in the administration signals the populist wing’s resurgence within a presidency that has traditionally favored tech and financial sector allies. Earlier this year, she had an X account suspended and lost access to certain pay features after she challenged Elon Musk’s stance on visas for skilled workers claiming that they go against the “America First” agenda.
- Loomer’s rise amid Musk’s waning clout underscores the president’s transactional leadership, rotating favor between party factions as political winds shift. Should populists consolidate influence, expect a doubling down on contentious policies, potentially rattling markets with abrupt ideological pivots.