by Patrick Fearon-Hernandez, CFA, and Thomas Wash
[Posted: 9:30 AM ET] | PDF
Good morning! The market is currently digesting the latest news regarding tariffs. In sports, the St. Louis Cardinals begin their season today, embarking on what promises to be a historic run for the World Series title this year. Today’s Comment will delve into the latest developments on auto tariffs, an update on the TikTok deal, and other pertinent market news. As usual, this report will also include a summary of key international and domestic data releases.
More Tariffs, More Problems: Wednesday’s tariff announcement marks the administration’s latest move to reshape trade policy, even as Federal Reserve officials and business leaders voice growing apprehension about its potential economic impacts.
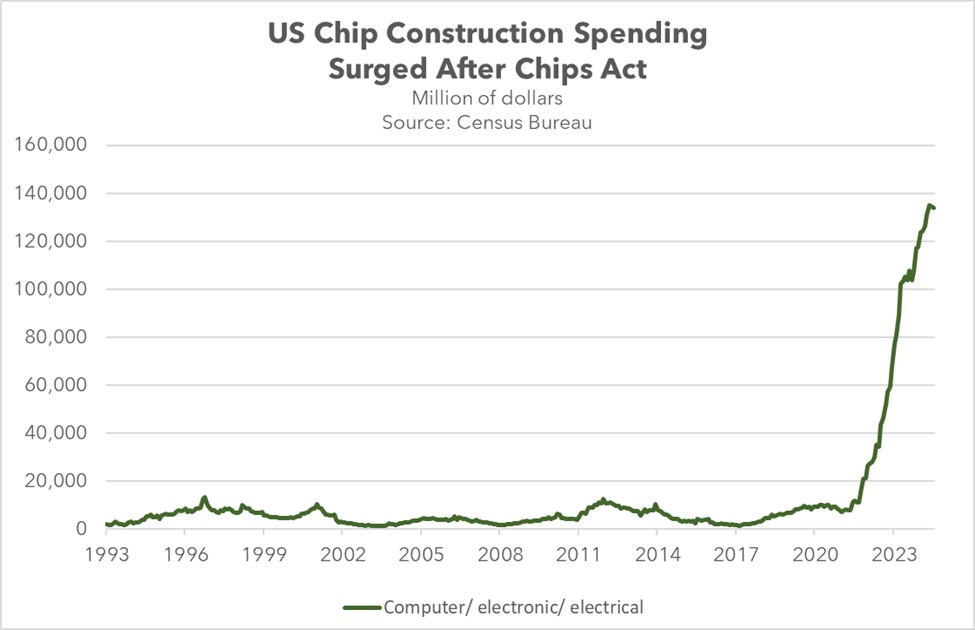
- President Trump will impose sweeping new 25% tariffs on automotive imports, set to take effect next week, as part of his administration’s efforts to reshore vehicle manufacturing. The tariffs will comprehensively cover finished vehicles and critical components, including engines, powertrains, transmissions, and electrical systems. Notably, these tariffs will be implemented as permanent measures without exemptions.
- The president has consistently maintained that these protectionist measures are essential to safeguard America’s industrial base and national security. This justification originates from his administration’s 2019 Section 232 investigation into automotive imports under the Trade Expansion Act, which authorizes executive action when imports are deemed to threaten national security interests.
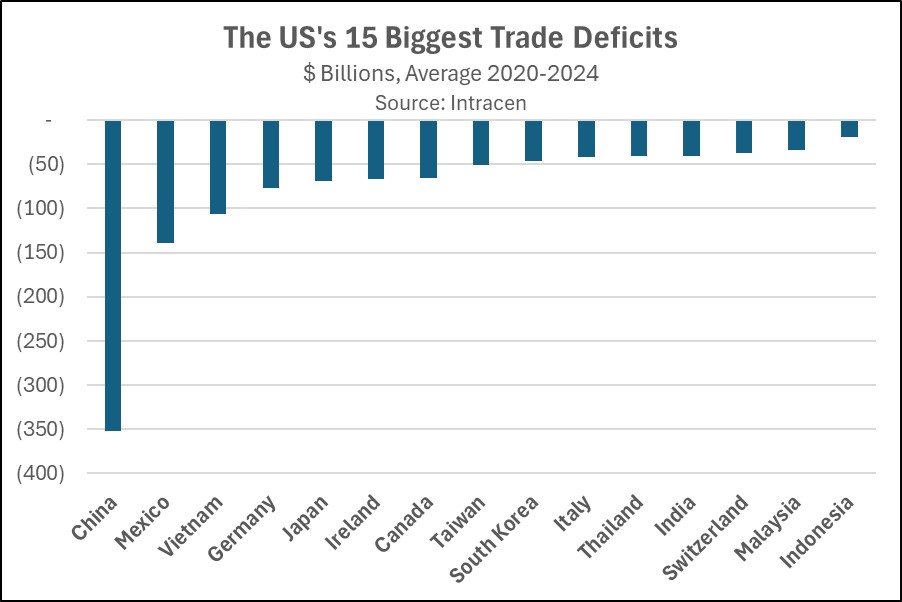
- New tariffs will disproportionately affect foreign automakers by reducing the price competitiveness of their vehicles in the US market. Mexico and South Korea appear particularly vulnerable, having significantly expanded their automotive exports to the United States in 2024. With imports accounting for nearly half of all vehicles sold domestically last year, American consumers may also face higher prices and reduced choice in the marketplace.
- Fed officials have warned that new tariffs may constrain their ability to implement further rate cuts this year. Atlanta Fed President Raphael Bostic recently challenged Chair Powell’s assessment of tariffs as transitory, revising his projected rate cuts for 2025 from two down to one. Meanwhile, St. Louis Fed President Alberto Musalem warned that hawkish trade policy could generate secondary inflationary effects, potentially prolonging the economic impact of tariffs beyond just a one-time effect.
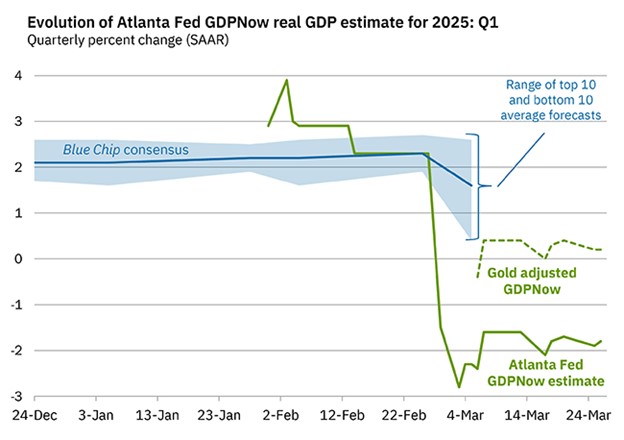
- Furthermore, business leaders are increasingly concerned about a potential economic recession. A recent survey of CFOs revealed that almost 60% anticipate an economic downturn within the next six months, with an additional 15% expecting it in 2026. These fears are seemingly supported by the highly anticipated update in the Atlanta GDPNow forecast, which projects a severe economic slowdown in the US economy during the first quarter, when adjusted for gold imports.
- A key focus for us has been observing the market’s reaction to the latest trade developments. Although the market closed lower yesterday, it’s noteworthy that the VIX remained below the critical level of 20. This suggests that the immediate impact of the tariff actions on equities may be diminishing. Looking ahead, the market’s primary focus will shift to economic indicators. Continued GDP growth could provide some upside for the market; conversely, a contraction could lead to an increase in market pessimism.
Hardball Tactics: While often discussed as a tool for reindustrialization, the administration has highlighted tariffs’ broader strategic uses, including pressuring foreign regulatory reforms and securing critical acquisitions.
- President Trump has signaled a potential reduction of certain Chinese tariffs as leverage in negotiations to transfer TikTok to US ownership. This conciliatory gesture follows his administration’s recent imposition of 20% tariffs on targeted Chinese imports, while broader product-specific duties remain in effect. Although Beijing would welcome tariff relief, the Chinese government — whose approval is required for any sale — remains adamant that ByteDance retains control of TikTok’s core algorithm.
- China may not be the only target of such measures. The Trump administration has repeatedly stated its willingness to impose tariffs on European allies unless they amend legislation perceived as discriminatory toward US technology firms. Furthermore, officials have pushed for the elimination of the EU’s value-added tax system, despite its non-discriminatory application across all companies.
- The administration’s tariff strategy appears to be driven by a wider geopolitical vision, and a desire to position the United States as the central hub of global commerce. This approach is not solely focused on domestic re-industrialization but also involves actively supporting US corporations in acquiring strategic foreign competitors and in influencing international regulations deemed detrimental to American business interests.
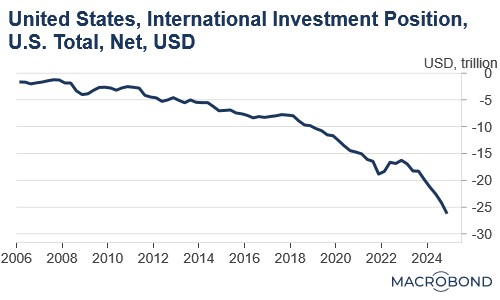
- A crucial metric to monitor is the US net international investment position (NIIP), which measures the difference between US-owned assets abroad and foreign-owned assets within the US. This gap has recently widened to its largest recorded level, indicating a growing foreign ownership of US assets. The administration may be considering policies to reduce this imbalance as part of its broader objective to reshape the global economic landscape. If successful, large-cap US corporations would likely be primary beneficiaries.
Enough about Tariffs, Now NATO: Amid growing European doubts about America’s NATO commitments, the transatlantic military alliance has reaffirmed its readiness to defend itself and its allies should the need arise.
- The NATO Secretary General has unequivocally declared the alliance’s readiness to deploy its full military capabilities in response to any Russian aggression against Poland or other member states. These remarks come as Moscow nears a potential agreement with the US to end its invasion of Ukraine — a development that has heightened concerns about possible Russian expansion of hostilities to other European targets.
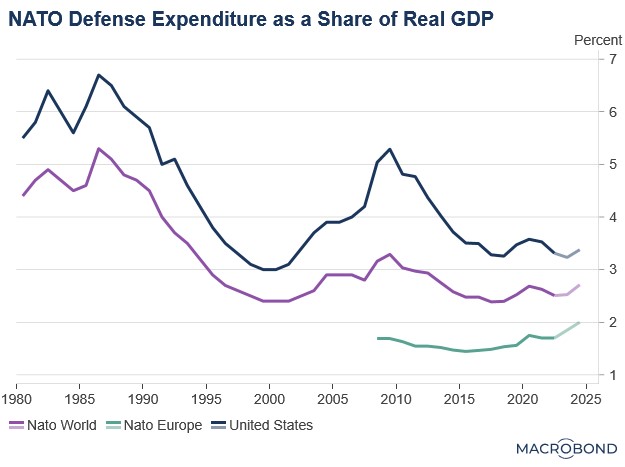
- The escalating Russian threat has prompted European nations to significantly boost defense expenditures, aiming to ensure self-sufficiency amid concerns about potential US disengagement from NATO. Poland has emerged as the vanguard of this strategic realignment, committing to spend 4% of GDP on defense — the highest percentage among NATO members — while actively pursuing nuclear-sharing arrangements to enhance its deterrent capabilities.
- Europe’s drive for greater military autonomy is expected to benefit defense sector equities across the bloc. However, the substantial borrowing required to fund this expansion may exert upward pressure on interest rates. One potential mitigation strategy would be the introduction of EU-backed guarantees for joint defense bonds. While discussions about such mechanisms are ongoing, concrete progress toward implementation remains limited.
BOJ Pause: The Bank of Japan’s hawkish stance faces headwinds from trade uncertainty, pushing back the timeline for any potential rate policy normalization.
- BOJ Governor Kazuo Ueda has emphasized maintaining policy flexibility ahead of the central bank’s May 1 meeting. His cautious approach to rate hikes stems from concerns that tightening monetary policy amid escalating trade tensions could potentially harm Japan’s economic recovery.
- Japan has seen an increase in its inflation over the last few months, with the inflation reading hitting 3% in February. The lack of action to ensure that inflation falls to target is likely to put further pressure on the Japanese yen (JPY) which recently surpassed 150 per dollar.