by Patrick Fearon-Hernandez, CFA, and Thomas Wash
[Posted: 9:30 AM ET] | PDF
Good morning! The market is currently digesting the latest jobs data. In sports news, Dave Roberts and the Los Angeles Dodgers are nearing a long-term contract agreement. Today’s Comment will cover the latest developments in the trade war, the reasons behind the differing views on the path of monetary policy by Fed officials, and other market-related news. As usual, the report will conclude with a summary of domestic and international data releases.
Trade War on Pause? For the second time this week, President Trump has delayed tariffs on goods. However, uncertainty remains widespread as businesses grapple with understanding the impact of trade policies on the economy.
- On Thursday, the Trump administration announced that goods covered under the 2020 North American trade agreement would be exempt from tariffs. This move comes a day after the president exempted auto goods from tariffs. The reversal appears to be a response to domestic backlash, as many US firms expressed concerns that the tariffs could severely disrupt their supply chains.
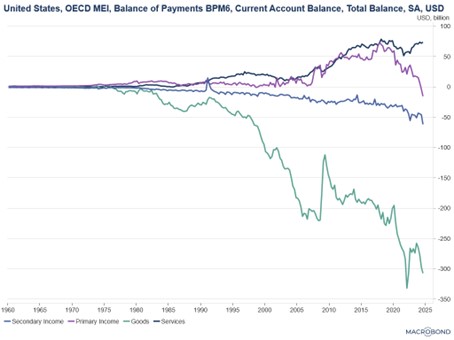
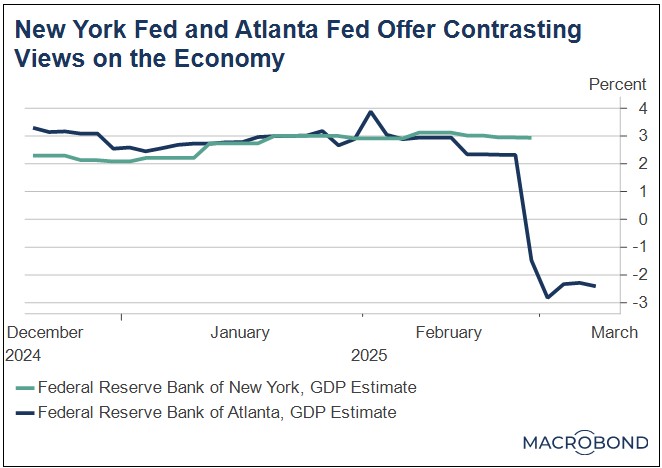
- Newly released data showed the US advanced trade deficit in goods deepened in January as imports surged. This increase was attributed to businesses stockpiling goods ahead of expected tariffs, a strategy likely aimed at mitigating the impact of the ongoing trade dispute. The significant rise in imports was a key factor in the Atlanta Fed’s GDPNow forecast, which currently indicates a potential contraction in the US economy.
- While tariffs targeting Canadian and Mexican goods have been put on hold, the aluminum and steel tariffs are expected to take effect on March 12. Additionally, reciprocal tariffs, designed to pressure countries into reducing their trade barriers, are set to be implemented on April 2. As a result, the recent U-turn on tariffs has created even greater uncertainty about what could unfold in the coming weeks.
- While the US has reduced some tariffs, other countries have maintained theirs, and Canada has increased certain measures. Ontario Premier Doug Ford announced plans to raise electricity tariffs on Michigan, Minnesota, and New York. Additionally, Canadian provinces have pushed to remove US-made alcohol from shelves, demonstrating that trade hostilities persist despite the brief reprieve.
- While the tariff reversal is likely to reduce some disruptions in the coming weeks, it will still have a major impact on economic data, particularly for those attempting to front-run the tariffs. As a result, this could weigh on US GDP growth in the future. That said, the possibility of a recession remains 50/50, as it is unclear whether consumers will absorb some of the tariff costs. In short, the trade war is far from over.
Monetary Policy Uncertainty: Less than a week before Federal Reserve officials are set to meet, there is still no clear direction on where they might set policy for the rest of the year. While several members have expressed concerns that tariffs could exacerbate inflation, others have remained optimistic.
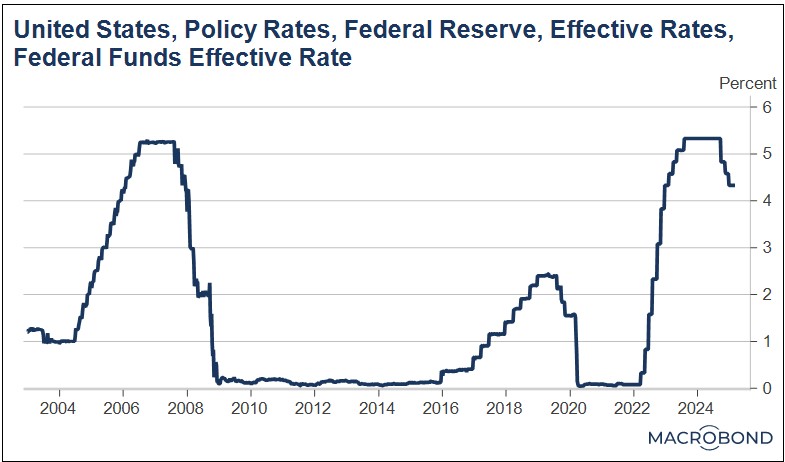
- Fed Governor Christopher Waller suggested the possibility of two or three interest rate cuts this year. While he dismissed the likelihood of cutting rates at the upcoming meeting, Waller left the possibility open for a rate reduction in May. He emphasized that any decision to lower rates would be driven by sustained progress on inflation, rather than a reaction to economic weakness. Furthermore, he downplayed concerns about tariffs significantly impacting inflation, suggesting their effect would likely be limited.
- Waller’s comments appeared to diverge from the more cautious stance of many of his colleagues regarding the possibility of rate cuts. Later that day, Atlanta Fed President Raphael Bostic noted that uncertainty surrounding future policy makes it unlikely the Fed will move on interest rates before late spring or early summer. Earlier in the week, New York Fed President John Williams had also struck a more cautious tone, specifically highlighting tariffs as a potential risk to inflation.
- The divergence between Waller’s views and those of many of his colleagues comes at a time when market expectations for monetary policy have undergone a complete reversal. Before last Friday, markets had priced in no rate cuts for the year. However, sentiment shifted sharply following the release of the PCE price index, which showed a deceleration in price inflation, alongside weaker-than-expected economic data. Now the market is pricing in three or maybe four rate cuts this year.
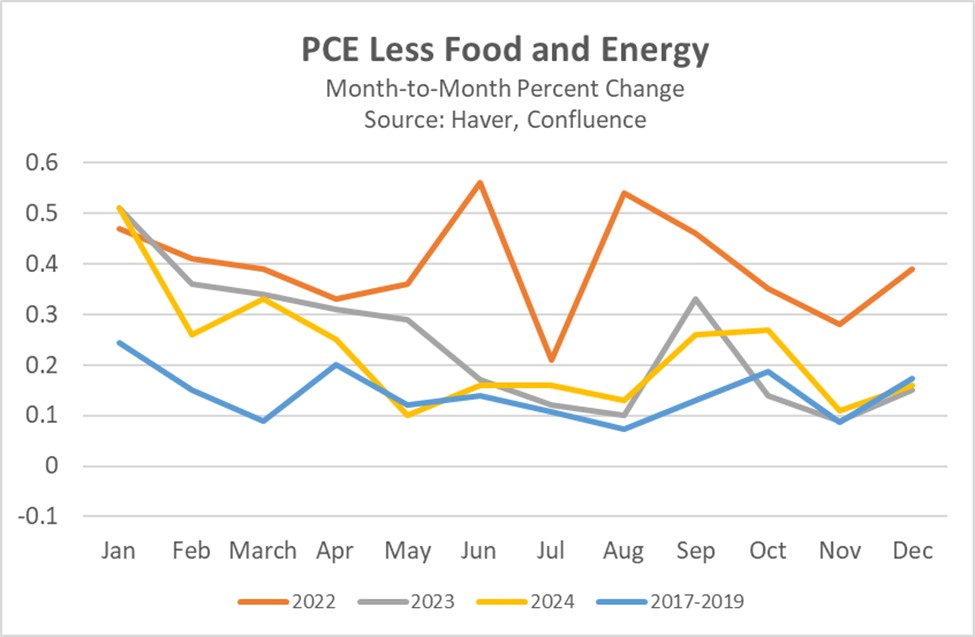
- As highlighted in our previous reports, the Fed is likely to have the most success at the start of the year as opposed to the end of the year in bringing inflation down closer to target. This is supported by the latest Cleveland Fed Nowcast for Inflation, which projects the April PCE price index report will show overall inflation falling below 2.1%. That said, we continue to believe that, barring a recession, the Fed is likely to cut rates no more than twice this year.
Ukraine Update: Officials in the European Union, along with Congressional Republicans, are working to help repair relations between Ukrainian President Volodymyr Zelensky and US President Donald Trump.
- Despite their differences, it is widely anticipated that the two leaders will reach a minerals agreement, which could help pave the way for a potential peace deal with Russia. In a gesture of goodwill ahead of his meeting with US officials, Zelensky has called for an enforced “silence in the sky.” Meanwhile, US officials are scheduled to meet with their Ukrainian counterparts to facilitate peace negotiations.
- While President Trump has shown no signs of softening his stance, members within his own party are actively pushing for a change in approach. Several GOP senators have urged the president to resume intelligence sharing and provide renewed aid to Ukraine. Their insistence stems from concerns among many Republicans that Ukraine may be losing leverage in negotiations with Russia to end the war.
- Since the controversial meeting between Zelensky and Trump last week, Russia has seized the opportunity to intensify its attacks, aiming to strengthen its position in future negotiations. Putin has made it clear that he has no intention of retreating from territorial gains unless he secures guarantees for Russia’s long-term security.
- While tensions between the US and Ukraine persist, there appears to be a potential pathway toward ending the Russian invasion. A resolution to the conflict could ease pressure on oil prices and provide a boost to European equities.
China’s Annoyance: While President Trump offered some tariff concessions to North American counterparts, the levies on Chinese goods remained unchanged. Compounding the situation are indications that the Trump administration may be exploring the formation of a North American trade bloc.
- China’s foreign minister criticized the US for what he characterized as a “two-faced” approach to bilateral relations, pointing to perceived inconsistencies. He highlighted President Trump’s complimentary remarks toward President Xi contrasted with the implementation of trade tariffs as examples of these mixed signals.
- His remarks follow new trade measures by Mexico to also review tariffs on Chinese imports. The move was seen as a way to curry favor with the incoming administration as they look to prevent a broader trade war with Mexico.
- The United States’ ability to persuade more allies to impose tariffs on China is likely to fuel Beijing’s concerns about being isolated from the global community. However, this outcome hinges on Washington’s capacity to maintain unity among its allies — a challenging task, given apprehensions about potential US tariffs. That said, a unified front against China could serve as a strategic off-ramp for US allies seeking to preserve their relationships with Washington while addressing shared economic concerns.