

Author: Amanda Ahne
Asset Allocation Bi-Weekly – Our Take on the Initial Trump Tariffs (February 18, 2025)
by the Asset Allocation Committee | PDF
While investors broadly understood that the new Trump administration would impose import tariffs as a key part of its economic policy, concrete details weren’t available until the initial tariff announcements on February 1. Even though some of those tariffs were quickly “paused,” the announcements gave us our first chance to explore how the administration intends to wield this weapon against other countries. This report provides our first take on the initial Trump tariff policies. As we show below, we think it’s still too early to gauge the impact that trade policy will have on inflation. What we can say is that the policies are likely to be disruptive for many sectors of the global economy, potentially prompting safe-haven buying in US Treasury obligations and precious metals.
In its February 1 announcement, the administration imposed 25% tariffs on most goods from Canada and Mexico, 10% tariffs on Canadian energy imports, and additional 10% tariffs on imports from China. For legal basis, the White House cited emergency economic authority based on fentanyl trafficking from those countries. Within about 48 hours, however, the administration announced a one-month pause in the tariffs against Canada and Mexico after those countries agreed to minor concessions, such as deploying more troops to their borders with the US to clamp down on illegal crossings and drug shipments. As of this writing, Beijing has made no concessions, so the tariffs on Chinese imports remain in place. At some point, the administration is also expected to impose tariffs against the European Union and potentially against multiple individual countries in Asia and beyond.
Mainstream economists tend to believe that import tariffs are inflationary, at least in the short term, because they can restrict the supply of goods to the domestic market. However, we don’t think investors should blindly assume that’s the case. For many reasons, tariffs may not put much upward pressure on prices. After all, some importers may have little market power and be unable to pass the cost of the tariffs onto their customers. In those cases, the importer would simply suffer lower profit margins. The threat of higher input prices might also discourage firms from investing, reducing overall demand in the economy and potentially offsetting price pressures. The impact on prices would likely differ across industries, depending on how quickly each industry can adjust to the tariffs. Therefore, much depends on whether the tariffs are applied broadly against all imports or targeted against specific trade partners and/or products. Finally, retaliation by the targeted trade partner has to be considered. For instance, countries hit with US tariffs might slap tariffs against US goods, thereby slowing down export growth, increasing domestic supply, and weighing on price pressures. The targeted countries might also impose retaliatory tariffs or embargos on their exports to the US, pushing up inflation.
Nevertheless, although it’s difficult to gauge the impact of tariffs or related trade barriers, the discussion above shows they can certainly be disruptive. Even the modest additional tariffs of 10% against the Chinese, which are already in place, will likely prompt reactions from businesses and consumers, and the net impact of those reactions remains unknowable. Beijing has also already retaliated by imposing tariffs on some US goods, preparing to curb shipments of certain minerals to the US, and ratcheting up regulatory scrutiny of US firms operating in China. For now, we think the main market reaction to the tariffs relates to the potential for economic disruption and uncertainty. In particular, it appears the tariffs have prompted investors to bid up safe-haven assets such as gold, silver, and longer-term bonds.
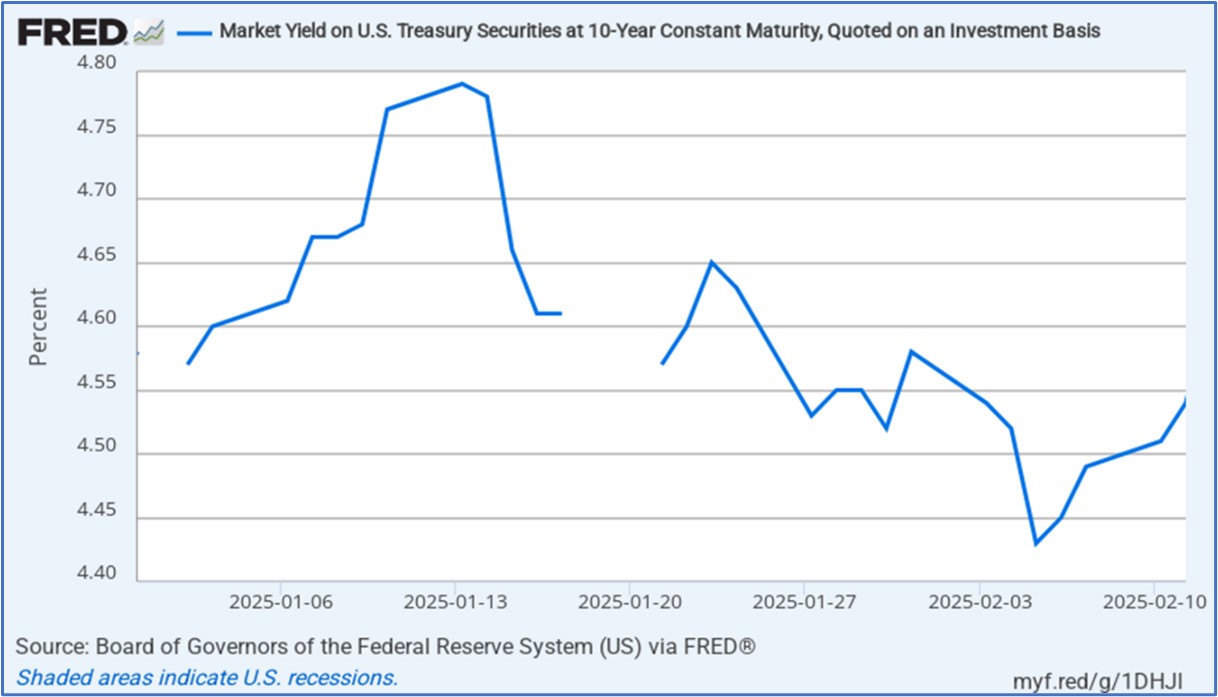
As shown in the chart below, the yield on 10-year US Treasury notes rose sharply to 4.65% over the first two days after President Trump was inaugurated, when investors were pleasantly surprised by the lack of any immediate tariff action despite the president’s earlier promises. Over the following two weeks, however, as the administration put more of its policies into place and investors could sense the possibility of economic disruptions, they bid up Treasurys, driving down yields. Once the Canadian, Mexican, and Chinese tariffs were announced at the start of February, the flight to safety intensified, pushing Treasury yields even lower to below 4.45%, although they have rebounded somewhat since then.
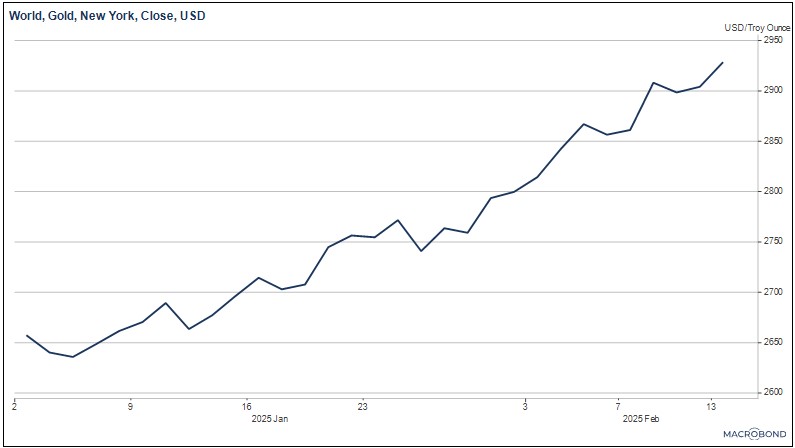
In the next chart, we show the progression of gold prices over the same period. Here, we see a pullback in gold prices in the period immediately after Trump’s inauguration, when his earliest executive orders and other policy announcements still seemed relatively tame to many investors, reducing the demand for safe-have assets. By early February, once the tariffs were announced, the general uptrend in gold prices re-accelerated, driving prices for the yellow metal to record highs above $2,900 per ounce.
As mentioned, it’s still too early to know whether Trump’s apparently neo-mercantilist economic policy and its associated tariff program will be inflationary. However, it does seem clear that investors are focused on the risk that the tariffs will drive prices higher and the potential for them to create economic disruptions. Investors are therefore bidding up traditional safe-haven assets, including longer-term Treasury obligations and gold. If and when the administration applies tariffs to the EU or other economies, we suspect longer-term Treasurys and gold could see another round of safe-haven buying. Based on technical analysis, we think the yield on the 10-year Treasury could be pushed down to its next major support level at about 4.17%, while gold could be pushed higher to its next expected resistance levels of $3,000 or $3,100 per ounce. Treasurys and gold could continue to be well bid until investors sense that the international trade environment has stabilized.
Don’t miss our accompanying podcasts, available on our website and most podcast platforms: Apple | Spotify
Daily Comment (February 14, 2025)
by Patrick Fearon-Hernandez, CFA, and Thomas Wash
[Posted: 9:30 AM ET] | PDF
Note: Due to the holiday, the Daily Comment will not be published on Monday, February 17.
Happy Valentine’s Day! The market is currently processing the latest retail sales data. In sports news, the US dominated Finland in the NHL 4 Nations Face-Off. Today’s Comment will explore the shifting landscape of US foreign policy, examine the possibility of gold revaluation, and cover other market-related news. As usual, our report will include a summary of domestic and international data releases.
DIY Foreign Policy, We Can Help: President Trump has increasingly downplayed the US’s traditional role as the “world’s policeman,” and instead is emphasizing its position as a leading defense supplier. This shift reflects a deliberate strategy to scale back America’s global security responsibilities while encouraging other nations to enhance their own defense capabilities.
- On Thursday, President Trump raised the possibility of convening a meeting between Russia and European nations to discuss a joint agreement to reduce their defense expenditures. While it remains uncertain whether Putin or Xi would be open to such a proposal, the suggestion underscores President Trump’s broader inclination to scale back US global influence.
- Additionally, this move reflects President Trump’s broader strategy of engaging with rival powers to ease global tensions. By excluding the European Union from discussions on the Russia-Ukraine conflict and proposing the inclusion of China in future negotiations, the administration signals a willingness to bypass traditional allies in favor of direct diplomacy with major geopolitical competitors.
- This shift in US priorities has prompted Europe to reevaluate its security framework. French President Emmanuel Macron has been a vocal advocate for greater European self-reliance, urging EU member states to take more responsibility for their collective defense, particularly in supporting Ukraine.
- That said, President Trump has been actively pushing US allies to buy more American-made weapons, framing arms sales as a key tool for addressing trade imbalances and making countries more self-reliant for security. On Thursday, he underscored this strategy in talks with Indian Prime Minister Narendra Modi about a potential F-35 fighter jet deal. The announcement came as Defense Secretary Pete Hegseth pledged to accelerate arms sales to EU nations.
- The shift from being a global security provider to a leading defense supplier represents a calculated, albeit tactical, adjustment for the US as it seeks to balance its international influence with domestic economic priorities. By encouraging allies to take on greater defense responsibilities, the US aims to reduce its direct military burdens while maintaining its geopolitical clout. While there are some concerns about the impact this shift will have on defense stocks, we remain cautiously optimistic about the sector.
Gold As a Policy Tool? Despite disinterest from the Trump administration, a controversial proposal to revalue US gold reserves at the current market price of approximately $3,000 per ounce is gaining traction as the government seeks additional funding.
- Changing the book value from the fixed rate of $42 per ounce could generate a one-time windfall of roughly $760 billion, which could be used to support the president’s agenda. This revaluation could allow the government to sell gold on the open market to help achieve some of its policy aims.
- One potential application would be to sell gold and use the proceeds to purchase other currencies, thereby weakening the US dollar. Alternatively, the revenue from gold sales could be used to fund government spending, potentially facilitating the passage of budget legislation.
- Two obstacles could impede the revaluation of gold. Because the price is fixed by law, congressional approval would be necessary. Also, significant gold sales could depress global prices, posing political risks and potentially harming the global financial system, given that many central banks hold gold as a reserve asset.
- While the revaluation of gold is not currently under consideration by the Trump administration, the idea could gain traction if the administration struggles to achieve its agenda, particularly in the realm of trade policy. In such a scenario, revisiting the revaluation of gold as a fiscal tool may become a viable option. Given this potential, gold remains an attractive investment for many, although future policy moves — such as revaluation — could significantly influence market sentiment.
Axis of Evil: The Pentagon’s Indo-Pacific chief, Admiral Samuel Paparo, has expressed growing concerns that China may be preparing to assert control over Taiwan. This warning comes at a time when the US is actively encouraging allies and partners to reduce their reliance on American military protection and instead bolster their own defense capabilities.
- Speaking at the Honolulu Defense Forum, the Pentagon chief cautioned that the scale and frequency of China’s military exercises could serve as a pretext to mask an actual offensive against the island. By conducting extensive drills, China might create a veil of ambiguity, making it difficult to distinguish between routine training and a genuine threat.
- Paparo also pointed to the deepening cooperation among Russia, China, and North Korea as they increasingly coordinate efforts to counter US influence and power projection worldwide. These nations have been actively sharing intelligence and technology, strengthening their strategic alignment to challenge American dominance.
- His message likely explains why the Trump administration is shifting its strategic focus toward the Indo-Pacific region, prioritizing efforts to counterbalance China’s growing influence, while reducing its emphasis on protecting Europe.
- A major threat to the global economy is large-scale warfare, particularly involving major powers. Increased assertiveness by China and its partners in the Indo-Pacific, coupled with the US pivot to the region, raises the risk of confrontation, especially as the two economies decouple. While an immediate military conflict is unlikely, the risk within the next decade may be increasing.
The Big Beautiful Bill Progresses: Conservative lawmakers have finally reached an agreement on a budget resolution aimed at advancing the president’s initiatives through a single bill. The breakthrough came after fiscal hawks within the Republican Party insisted on guarantees for budget cuts to ensure that the proposed initiatives would not exacerbate the deficit.
- The bill passed out of committee on Thursday, moving one step closer to becoming law. The proposal would authorize $1.5 trillion in spending cuts to help fund the president’s tax initiatives, increase the defense budget, and provide funding for border security.
- One of the more controversial elements of the proposal includes potential cuts to Medicaid, a move supported by many Republican lawmakers who argue that the program is plagued by fraud and inefficiency. However, such reductions are likely to render the bill politically contentious, as critics warn the cuts could harm vulnerable populations who rely on the program for essential healthcare.
- While we anticipate that tax cuts will likely be enacted by the end of the year, we remain skeptical that the final bill will achieve the budget neutrality that current lawmakers are aiming for. That said, we believe the proposed tax reductions could provide a boost to equities and may also support bond markets if the administration successfully avoids significantly increasing the budget deficit in the process.
Business Cycle Report (February 13, 2025)
by Thomas Wash | PDF
The business cycle has a major impact on financial markets; recessions usually accompany bear markets in equities. The intention of this report is to keep our readers apprised of the potential for recession, updated on a monthly basis. Although it isn’t the final word on our views about recession, it is part of our process in signaling the potential for a downturn.
The Confluence Diffusion Index rose above the recovery indicator for the third consecutive month. However, the December report showed that six out of 11 benchmarks remain in contraction territory. For December, the diffusion index was unchanged at -0.0909 and is above the recovery signal of -0.1000.
- Optimism about the economy helped lift equity prices.
- Manufacturing activity showed signs of slowing.
- Labor market conditions were relatively unchanged.
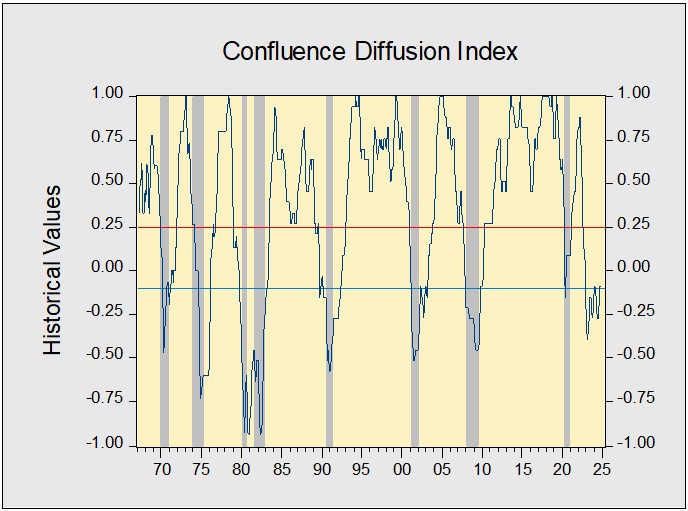
The chart above shows the Confluence Diffusion Index. It uses a three-month moving average of 11 leading indicators to track the state of the business cycle. The red line signals when the business cycle is headed toward a contraction, while the blue line signals when the business cycle is in recovery. The diffusion index currently provides about six months of lead time for a contraction and five months of lead time for recovery. Continue reading for an in-depth understanding of how the indicators are performing. At the end of the report, the Glossary of Charts describes each chart and its measures. In addition, a chart title listed in red indicates that the index is signaling recession.
Daily Comment (February 13, 2025)
by Patrick Fearon-Hernandez, CFA, and Thomas Wash
[Posted: 9:30 AM ET] | PDF
Good morning! The market is processing the latest developments in Ukraine. In sports news, Canada was able to defeat Sweden in the NHL 4 Nations Face-Off. Today’s Comment will take a deeper dive into the CPI report, discuss the latest developments in the Ukraine-Russia talks, and provide updates on US congressional budget talks as well as other market news. As usual, it will include a roundup of international and domestic data releases.
CPI Fails First Test: The January CPI report surprised markets with a stronger-than-expected acceleration. Headline inflation rose to 3.0% from 2.9% year-over-year, and core inflation edged up to 3.3% from 3.2%. This higher reading led traders to scale back their forecasts for rate cuts this year from two to one and drove the 10-year Treasury yield upward.
- The good news is that despite the rise in the inflation report many of the sharp increases appear to be temporary. For instance, financial insurance was one of the primary drivers of inflation, and the increase is likely tied to the adjustment of premiums for the costs associated with the natural disasters that occurred toward the end of the year. Additionally, owners’ equivalent rent and rent for primary residences, which are heavily weighted in the index, remained relatively subdued.
- The bad news is that the disinflationary pressure from new and used car prices, which had been a significant drag on the index, seems to be fading. This could mean that services, lately a persistent source of inflationary stickiness, will need to bear a greater burden in reducing overall inflation. Moreover, this development raises the risk of a resurgence in goods inflation, particularly if tariffs are implemented.
- The ugly news is that the window for making substantial progress toward the Fed’s 2% inflation target is narrowing. As highlighted in earlier reports, the first few months of the year typically offer the best opportunity for the Fed to make meaningful strides in lowering inflation. This is because the high readings from early 2024 are more likely to be replaced by figures that align with the long-run average as the year progresses.
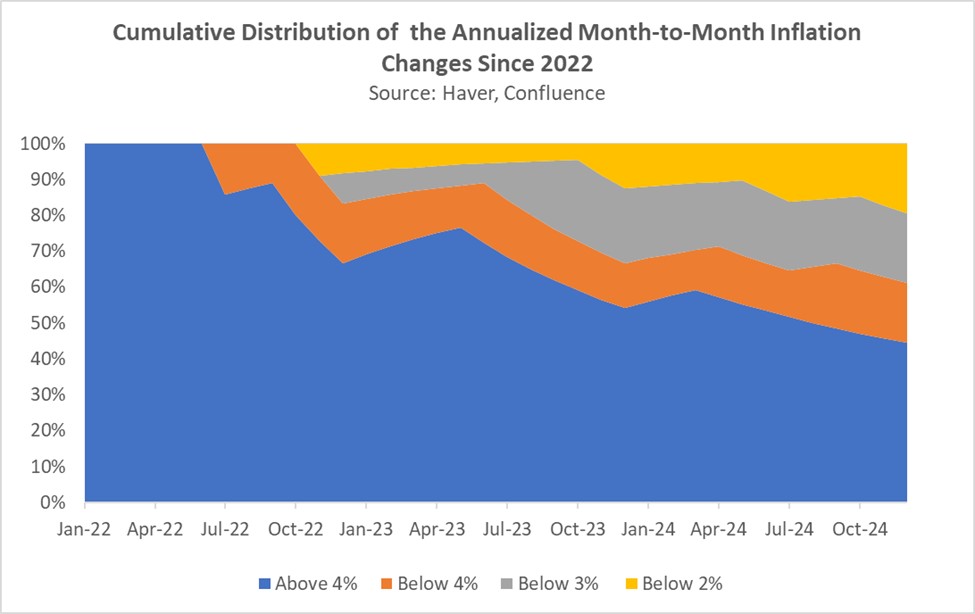
- While the January inflation report was disappointing, with Fed Chair Powell noting that “more work needs to be done,” Fed officials remain confident that inflation could fall to 2% by early 2026. This optimism is rooted in the growing frequency of inflation reports showing that inflationary momentum continues to trend downward.
- As illustrated in the chart above, the number of annualized monthly inflation reports exceeding 4% has dropped significantly and now represents less than half of the reports since 2022. This marks a sharp decline from the first few months of that period, when all reports exceeded this threshold. Furthermore, a growing share of reports now show inflation below 3% and even at 2%, reinforcing the downward trajectory.
Ukraine War Talks: President Trump announced plans to hold talks with Russian President Vladimir Putin in an effort to help resolve the ongoing conflict in Ukraine. While no concrete plans to end the war have been proposed so far, it appears that Ukraine may need to make concessions and could increasingly rely on the European Union for additional support.
- Prior to the announcement, Defense Secretary Pete Hegseth stated that Ukraine’s expectation of regaining its pre-2014 borders was unrealistic. He also expressed skepticism about the possibility of Ukraine joining NATO if a deal to resolve the conflict were to be reached.
- Hegseth emphasized that the US would not deploy troops on the ground to ensure Ukraine’s security, adding that Europe would need to bolster its own presence to protect its borders as the US shifts more of its strategic focus toward countering China.
- The decision to push for concessions from Ukraine and Europe underscores the Trump administration’s view of the EU as a junior partner in the relationship. While this approach is likely to raise tensions between Washington and Brussels, it could also facilitate a resolution to the conflict — a prospect that has already strengthened European equities and boosted the euro.
Budget Breakthrough: Senate Republicans advanced their budget resolution out of committee on Wednesday, moving closer to meeting the president’s goal of securing funding for energy, defense, and border security. The measure establishes a fiscal framework that paves the way for conservative lawmakers to advance the Trump administration’s agenda through the budget reconciliation process.
- Despite progress in the Senate, House Republicans have struggled to gain momentum as they work to fulfill President Trump’s vision of a single “big, beautiful bill” that incorporates key elements of the Senate’s proposal, including the highly touted tax cuts. However, their efforts are being hampered by fiscal hawks, who are demanding deeper budget cuts before they agree to support the deal.
- The latest proposal from House Republicans has sparked significant controversy, as it seeks to identify $2 trillion in budget cuts, raising concerns that they may consider reductions to social programs like Medicaid and food assistance for low-income households.
- Lawmakers in both chambers of Congress are expected to vote along party lines on any portion of President Trump’s bill that includes tax cuts, making it increasingly likely that two separate bills will be passed rather than one. That said, any progress toward enacting tax cuts would likely be welcomed by equity markets, while proposed budget cuts could be favorable for bonds.
Reciprocal Tariffs: President Trump has vowed to impose tariffs on any country that levies duties on US goods. While the president has not specified which countries could be targeted, the timing of this announcement — coming just ahead of his scheduled meeting with Indian Prime Minister Narendra Modi — suggests it may serve as a negotiating tactic.
- The move is part of the president’s three three-prong approach to tariffs, known as the three Rs (Restriction, Revenue, and Reciprocity), which come from former President William McKinley.
- Restrictions involve leveraging trade policies to boost domestic manufacturing by limiting imports. Revenue tariffs impose taxes on imported goods, creating an additional income stream for the government. Reciprocal tariffs, on the other hand, are used as a tool to pressure other countries into lowering their own tariffs.
- While William McKinley achieved some success in advancing his trade goals, President Trump may face a more daunting challenge. The key difference lies in the two approaches — Trump is attempting to implement all three Rs simultaneously, whereas McKinley applied them in combination over time.
- Trump’s widespread use of tariffs to achieve multiple objectives may weigh on economic growth by making the investment environment less predictable. However, in the long run, these measures could potentially benefit exporters.
Confluence of Ideas – #41 “Reviewing the Asset Allocation Rebalance: Q1 2025” (Posted 2/12/25)
Daily Comment (February 12, 2025)
by Patrick Fearon-Hernandez, CFA, and Thomas Wash
[Posted: 9:30 AM ET] | PDF
Good morning! Markets are reacting to the latest inflation figures this morning. On the sports front, Real Madrid narrowly defeated Manchester City in the first leg of their highly anticipated playoff series. Today’s Comment will cover the increasing influence of AI, Fed Chairman Powell’s testimony before Congress, and other key market developments. We’ll also provide our regular roundup of the latest international and domestic economic data releases.
US AI vs Everyone Else: Vice President JD Vance declined to sign a declaration aimed at ensuring AI remains “safe, secure, and trustworthy.” Instead, he asserted that the United States is committed to leading AI development and governance, and aims to set global standards and rules. While acknowledging the importance of international collaboration, Vance emphasized the US’s ambition to become the global hub for AI manufacturing and innovation.
- Vance’s emphasis on the US taking the lead in shaping AI rules seems to be a deliberate response to the EU’s Digital Markets Act and Digital Services Act, which aim to create a more balanced competitive landscape between EU and US tech companies. The administration has made it clear that it will aggressively oppose any measures perceived as discriminatory against US firms operating abroad.
- Furthermore, his remarks suggest that the EU should take a subordinate role to the US in the global technology landscape — a stance that risks deepening tensions and complicating transatlantic cooperation. This approach appears to directly conflict with the EU’s ambitions to cultivate and strengthen its own domestic tech industry.
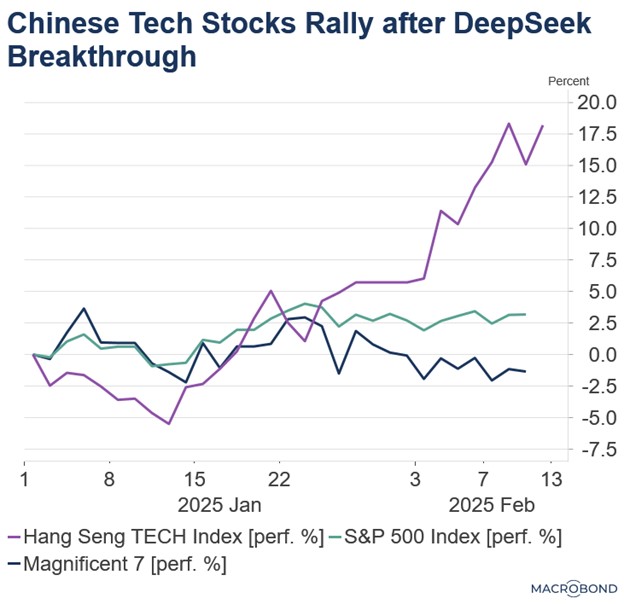
- Vance’s message comes at a pivotal moment as China continues to demonstrate its rising competitiveness in the AI sector. The recent breakthrough by DeepSeek, reportedly achieved with just $6 million and less sophisticated chips, has sent shockwaves through financial markets. This has prompted investors to increasingly turn their attention to Chinese tech companies, while casting doubt on the ability of their US counterparts to meet lofty valuations.
- Since the release of DeepSeek, Chinese stocks have surged, as investors view the breakthrough as a catalyst for revitalizing the sector and injecting new energy into the country’s equity markets. While the Magnificent 7 stocks are trading below their year-start levels, the Hang Seng TECH Index, which tracks leading Chinese tech companies, has climbed nearly 20% year-to-date, underscoring the shifting momentum in global markets.
- The recent rally in Chinese tech stocks faces significant headwinds. China’s economic challenges, often summarized as the five Ds — weak consumer demand, excess capacity and high debt, unfavorable demographics, economic disincentives stemming from Communist Party market interventions, and Western decoupling — pose substantial risks.
- Moreover, the US’s ability to sustain its relationship with Western allies will likely play a pivotal role in preserving its dominance in the tech sector as it looks to counter China. However, it is increasingly evident that the EU and the US could emerge as competitors in this space in the near future, potentially reshaping the dynamics of global technological leadership.
Powell Goes to Washington: Fed Chair Jerome Powell held the first of his two meetings with Congress on Wednesday. Markets showed little reaction to his testimony, as he provided no new insights into the future path of monetary policy. However, the hearing underscored the growing tension between the two parties as they continued to clash over the Department of Government Efficiency (DOGE) and how to address the budget.
- On monetary policy, Fed Chair Powell largely echoed the sentiment of his fellow colleagues stating the Fed is in no rush to cut interest rates but warned that the neutral rate was likely meaningfully higher than it was prior to the pandemic. When pushed to give his thoughts on the inflationary impact of tariffs, he resisted, and only stated that a rise in inflation was a possible outcome of new trade restrictions.
- Fiscal policy was also a key topic of discussion. Fed Chair Powell urged lawmakers to rein in spending, emphasizing that current levels are on an unsustainable trajectory. Additionally, he addressed Elon Musk’s recent cost-cutting efforts at DOGE, noting that the Treasury system remains secure from any breaches and clarifying that the group has no access to its systems. Furthermore, Powell suggested that the Fed may not require staff reductions but rather hires to effectively fulfill its responsibilities.
- Investors have driven up 10-year yields in recent weeks as they react to the ongoing debate over fiscal and monetary policy. The market is increasingly pricing in the risks of higher debt and inflation, which could limit the Federal Reserve’s policy options down the road. A continued rise in the yield is likely to raise borrowing costs for households and firms as well as be a source of headwinds for equities.
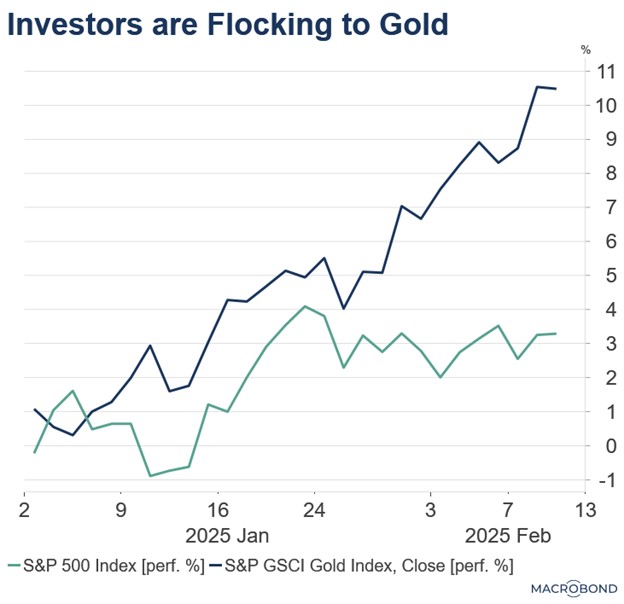
- Precious metals may offer a hedge against current economic uncertainty. Gold has seen a strong start to the year, rising 11.0% year-to-date and outpacing the S&P 500’s 3.0% gain over the same period. This preference for gold comes as investors and institutions become skeptical of the dollar’s use as a reserve asset. This trend could be further fueled by escalating trade tensions, which could weaken the dollar’s position as a reserve currency.
UK Growth Concerns: British Chancellor Rachel Reeves is facing mounting pressure after a watchdog downgraded its UK GDP growth forecast. Reeves had previously cited strong economic growth as a key rationale for avoiding harsh budget cuts, but the revised outlook has cast doubt on that justification.
- Reeves is scheduled to deliver her update on the budget on March 26. If growth does not meet the fiscal rules, she will be forced to make spending cuts to public services or welfare in order to balance the books.
- Thursday’s monthly UK GDP report is expected to offer valuable insights into the trajectory of the economy. If the data reveals strong growth in December, we anticipate a rally in UK bonds and equities, reflecting renewed investor confidence.
Ukraine War Update: While details of the negotiations between the US, Russia, and Ukraine to end the war remain undisclosed, it is evident that discussions are ongoing. In a recent development, a wrongfully detained teacher has been released from Russia, marking a potentially significant step amid the broader diplomatic efforts.
- Russia has intensified its attacks on Kyiv even as negotiations continue, signaling a dual strategy of military pressure and diplomacy. However, signs of economic fragility are emerging, particularly as borrowing costs rise and financial strain deepens. Meanwhile, Ukraine remains steadfast in the holding of its occupied territories, aiming to leverage them for potential negotiation swaps in the ongoing conflict.
- The likelihood of a ceasefire in the conflict has grown, but its impact on markets will largely hinge on whether Russia receives sanctions relief. This remains an open question, particularly given the Trump administration’s focus on bolstering US energy companies, which could complicate any decision to ease economic pressure on Moscow.
Daily Comment (February 11, 2025)
by Patrick Fearon-Hernandez, CFA, and Thomas Wash
[Posted: 9:30 AM ET] | PDF
Our Comment today opens with the latest vague promise by the Chinese government to boost consumer spending and spur economic growth. We next review several other international and US developments with the potential to affect the financial markets today, including a planned move by the European Union to make its fiscal policy more flexible and supportive of growth and the latest US import tariffs announced by the White House.
China: At a meeting yesterday, the State Council again said it would prioritize raising consumers’ income and consumption spending to spur economic growth. However, as in the past, the officials gave no details, which suggests the government remains ideologically opposed to a major new stimulus program. Some new spending programs are likely to be unveiled at the March legislative meetings, but we don’t expect them to be aggressive enough to overcome China’s increasingly difficult structural barriers to growth.
European Union: The European Commission is reportedly planning a major revamp of its next multi-year common budget, which begins in 2028. The plan would consolidate the dozens of different spending programs in the current budget to just three funds. The first would operate similar to a block grant, giving recipient countries wide flexibility in how to use the funds. The second would provide money for competitiveness and investment, while the third would provide funding for administration, foreign policy, and defense.
- The proposed structure is apparently how the Commission plans to get around the member countries’ disagreements over new challenges, such as common debt financing and increased defense spending.
- However, the plan is not yet set in stone, and it is still not certain if it will ultimately be approved.
France: Illustrating how trade tensions can crimp exports, industry association data shows that French wine and spirit shipments abroad fell approximately 4% in 2024 to 15.56 billion EUR ($16.04 billion). Exports to the US grew, especially for wine, but the overall total was held down by weak shipments to other countries. Importantly, shipments to China were down because of an antidumping probe that Beijing launched to retaliate for the EU’s dumping probe into Chinese electric vehicles.
US Monetary Policy: Federal Reserve Chair Powell starts his semi-annual testimony to Congress today with an appearance before the Senate Committee on Banking, Housing, and Urban Affairs at 10:00 AM ET. Naturally, investors will be looking for any clues on the future path of interest rates and how many rate cuts there might be in 2025. We will also be looking for how the Fed is thinking about the new administration’s tariffs and other economic policies. Powell will also appear at the House Committee on Financial Services tomorrow.
US Fiscal Policy: The federal judge who issued the January 31 restraining order against the Trump administration’s effort to freeze federal spending on diversity and other programs yesterday issued a new order demanding that the administration implement the first order. The new order responds to a suit by 22 states and the District of Columbia alleging that the administration has not yet unfrozen the affected funds.
- Another report by the Washington Post yesterday said some farmers are not receiving funds promised under the Biden administration’s Inflation Reduction Act, despite Trump’s assurances that his spending freezes would not affect individuals.
- The developments provide further evidence that the Trump administration intends to be aggressive about withholding even outlays approved by Congress. That increases the risk of an eventual constitutional crisis over presidential and Congressional powers.
- In addition, if the administration impounds large amounts of the federal budget, the sudden fiscal contraction could spark an economic slowdown or even recession. If government contractors, employees, or other firms or individuals sense that federal payments can no longer be taken for granted, they are likely to slow their spending. In turn, that could weigh on economic activity, boost bond values, and hurt stocks.
US Trade Policy: As expected, President Trump last night ordered tariffs on all US imports of steel and aluminum, including finished metal products, to be effective in early March. The new duties will be on top of the 25% levies on Canada and Mexico that are currently paused, the new 10% tariffs on goods from China, and the president’s upcoming reciprocal duties on other nations. As we noted in our Comment yesterday, the blanket nature of the steel and aluminum tariffs suggests the administration may not be inclined to offer exemptions to them.
- In response, the European Union today said it would respond to the new US tariffs with “firm and proportionate countermeasures.”
- EU member states have already approved retaliatory tariffs of up to 50% on 4.8 billion EUR ($4.96 billion) of US imports and could quickly take a final vote to impose them. The products affected could include bourbon whiskey, Harley-Davidson motorcycles, motorboats, and some US-produced steel and aluminum.
US Labor Market: In its March cover story, The Atlantic magazine highlights how high housing prices, mortgage rates, and other factors have sharply reduced many US residents’ ability to move to other locations to take advantage of better job opportunities. The article calls the fall in labor mobility the US’s “single most important social change of the past half century.” It also claims that only the affluent and well-educated seem exempt from the phenomenon.
- If affluence and a good education really have become the requirement for labor mobility, the phenomenon would probably help explain the rise of populism in the US over the last couple of decades.
- If the situation is not improved, it would also suggest that many stagnating states and communities could continue to struggle, holding back economic growth and fueling even more resentment toward elites, politicians, and government in general.
Bi-Weekly Geopolitical Report – Middle Eastern Stock Markets: An Overview (February 10, 2025)
by Daniel Ortwerth, CFA | PDF
All the attention paid to the strong performance of United States stock markets in recent years can easily distract us from what might be happening in other markets around the world. A quick review of global stock markets reveals that one region, the Middle East, has seen its market capitalization grow more rapidly over the last 10 years than any other region, including the US. This prompts an investigation into the reasons. Should investors give more consideration to the Middle East, or might there be other factors at play that explain the growth without necessarily translating into investable opportunities?
This report begins with a review of the global stock market, categorized by region and country. We next take a closer look at the fastest growing Middle Eastern markets, and we finish with considerations about the potential future for Middle Eastern stocks. As always, we conclude the report with investment implications.