Letter to Investors | PDF
Here we are in 2025. I must admit that, growing up in the 1960s, I couldn’t even imagine what 2025 would be like. If I had tried, I probably would have had some science fiction-like expectation — that I’d be commuting to work in a flying car, that I’d have robots doing the dishes and walking the dog, and that we’d be planning a vacation on Mars. In other words, I’d be living in the world of The Jetsons. It turns out that the world of 2025 is pretty much like the world of 1965, except that I have virtually an infinite number of channels on my TV (instead of five) and a cordless telephone in my pocket that I can use anywhere. We are still not on Mars (perhaps getting closer), and I have to walk my dog the old-fashioned way (I do have a little robot that will vacuum the floor, though not all that well). And my car works remarkably like the cars my dad had in the ‘60s (I have not gone EV).
It is true that I do my job very differently today. Typewriters and correction fluid have given way to personal computers. My slide rule is now an antique, replaced by computers and electronic calculators (even on that phone). And the worksheets that I produced using accounting paper and pencils in 1979 are now created and maintained on spreadsheet programs on computers. In fact, we can store millions of bits of data on offsite “cloud” storage devices that years ago would have required a warehouse full of boxes. Those of us in the so-called knowledge businesses work very differently than we used to, making us much more productive. But to be successful, we still have to make good decisions, and those require wisdom, something that is still not easily acquired.
Today, Wall Street is agog with the prospective boon that artificial intelligence (AI) might bestow. This latest technological advancement promises to solve the wisdom shortage. A machine that learns from history, much faster than humans can, will supposedly make better decisions than people can. Perhaps, but perhaps not. When I watched men walk on the moon 55 years ago, I thought that I’d be visiting there by now. It doesn’t look likely that I’ll be doing that in my lifetime. When I took my first airplane ride in 1966 (a Lockheed L-188 Electra, a beautiful turboprop), I figured that by now I’d be travelling at supersonic speeds, flying from St. Louis to New York in about 30 minutes. That also hasn’t happened yet.
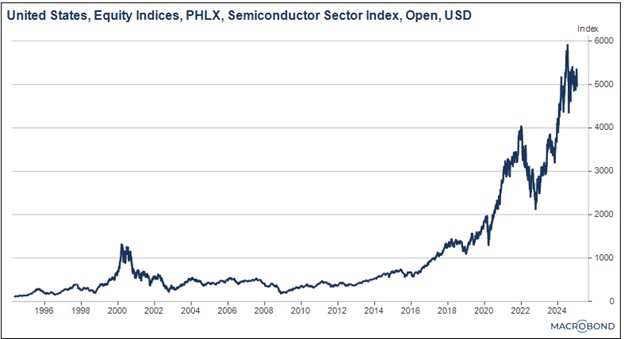
Technology tends to move forward in fits and starts. It scoots along at blazing speed for a spell, then slows down substantially. Investors, however, compress all that innovation into the present and value the most innovative businesses as if the future is now. AI stocks are the latest iteration of this trend. The sad fact is that Wall Street almost always gets far too optimistic far too quickly and then capitalizes those companies in new technologies at valuations that are far too hopeful.
As a young financial analyst in the early days of personal computers, I saw hundreds of young companies rise up in that industry and raise money seemingly overnight. Remember Compaq, Osborne, Kaypro, and Gateway computer companies? Apple and Dell were survivors; the vast majority were not. Personal computers turned out to be every bit as revolutionary as we thought they’d be, and even more so! It’s just that not very many companies survived to enjoy that growth.
In the first 20 years of the last century, almost 2,000 companies were formed to manufacture automobiles. By the mid-1920s, there were only about 300 left. By the late 1940s, 90% of all cars in the US were made by three companies. The creative destruction of capitalism is a wonderous thing. It creates magnificent things at great efficiency, but lots of capital is destroyed along the way. Yet, in every age, optimistic investors think that they hold the “winning lottery ticket”: a share in the company that will win the day. Perhaps. The new technology eventually produces the wonders we expect, but it usually occurs much later than expected and at the cost of lots of capital incinerated along the way.
We at Confluence love innovation and growth too, we just are not interested in gambling on who the winners and losers will be in the early days of investor excitement. As has often been noted, the leading edge of technology is also the bleeding edge. It’s usually better to wait a while and see who will win the competition, even if you end up paying more than if you got in at the “ground floor.” Or, alternatively, invest in some of the major companies who are themselves making investments in the new space. Chances are that they will see better investment opportunities than public investors ever will.
Everyone loves to hear stories about the guy who bought $1,000 worth of stock in a new technology that turned into $1 million. But did he do that without also losing a ton of money in other high-risk investments? It’s the risk side of the investment ledger that investors need to devote more attention. It should be the goal of all intelligent investors to produce excellent results on the return side of the ledger without exposing their funds to excessive risk. Our analysts, strategists, and portfolio management teams spend more time on risk management than on any other pursuit. I have always thought that if we manage the downside appropriately, the upside will take care of itself.
We appreciate your confidence in us and wish you all the best in this New Year.
Gratefully,
Mark A. Keller, CFA
CEO and Chief Investment Officer