by Patrick Fearon-Hernandez, CFA, and Thomas Wash
[Posted: 9:30 AM ET] | PDF
Good morning! Markets are closely analyzing the latest CPI inflation data as they assess the Federal Reserve’s next steps. In sports, more than 100 Olympic athletes from the Paris games have returned their medals due to unexpected deterioration. Today’s Comment will explore Trump’s proposal to establish a new agency to monitor tariff revenue, the potential impact of new export curbs on chipmakers, and other significant developments. As always, we’ll conclude with a summary of key international and domestic data releases.
External Revenue Service: President-elect Donald Trump announced plans to establish a new government agency dedicated to collecting revenue from import tariffs and taxes on foreign services on his first day in office. This move will likely solidify fears that the incoming president intends to implement wide-scale tariffs, a policy that has made both bond and equity investors wary.
- While US Customs and Border Protection traditionally handles the collection of foreign duties and tariffs, the creation of this new office signals the president’s intention to leverage tariffs as a significant revenue source. This move is likely aimed at reassuring the public that his proposed tax cuts will not substantially increase the national budget deficit.
- His reliance on tariff revenue to address the deficit comes as his administration seeks to deliver on key promises to extend the Trump tax cuts, raise the SALT deduction cap from $10,000 to $20,000, lower corporate tax rates, and, if possible, implement additional tax cuts aimed at benefiting working-class households.
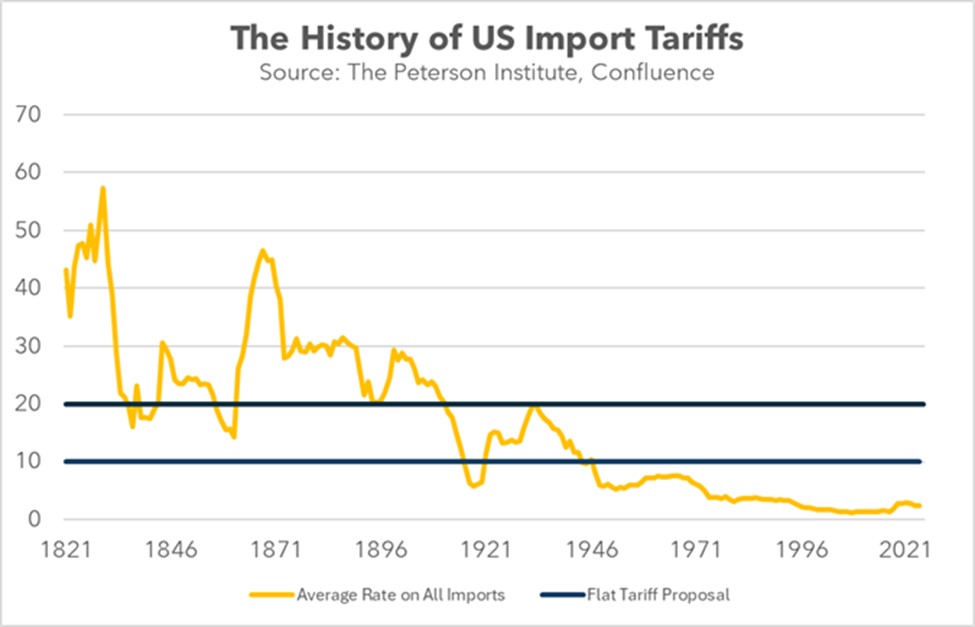
- Trump intends to impose a blanket tariff of 10 to 20% on all imports, with additional tariffs of 60 to 100% on goods originating from China. This would significantly increase the average tariff rate to its highest level in nearly six decades.
- Tariffs were a primary source of US government revenue in the 1800s, a time when the government was significantly smaller. Today, taxes on international trade contribute just 1.7% of government revenue, down from a recent peak of 2.1% over the past decade but well short of what would be needed to fund government spending. As a result, the president must either cut spending or rely on Americans continuing to purchase imported goods despite the tariffs.
- While we anticipate the president may impose tariffs, we are skeptical they will be as extensively applied as the market expects. Trump may need to scale back some of his proposals to make them more budget-friendly to increase their chances of becoming law.
Chipmakers Under Pressure: President Biden is expected to release new regulations aimed at preventing chipmakers from selling advanced chips to China. These moves are likely to further complicate the operating environment for semiconductor firms as they strive to maintain strong earnings amidst a growingly complex economic and geopolitical landscape.
- The new rules will place restrictions on all chips with a node size of 16 nanometers or smaller under a global regulatory framework. Those that meet the criteria will need an export license to sell to China and other countries deemed as posing a national security threat.
- The regulations will include provisions for companies to challenge these restrictions. This may involve demonstrating that their chip designs comply with the established criteria for permissible sales or providing evidence that their chips contain fewer than 30 billion transistors and are packaged by a trusted manufacturer.
- The companies targeted by the restrictions, Taiwan Semiconductor Manufacturing Co. (TSMC), Samsung Electronics, and Intel Corp., will likely be negatively impacted by the order. Intel receives nearly 27% of its revenue from China, while Samsung derives nearly a fifth of its chip revenue from the region. Ironically, TSMC has the lowest exposure of the three at 12.5%.
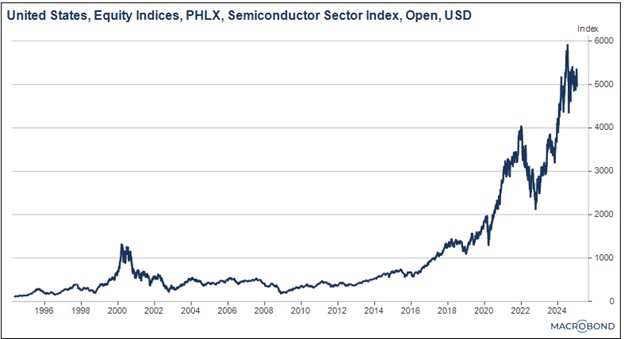
- Despite a robust 2024 with nearly 30% growth, the semiconductor sector has failed to surpass its July peak, indicating a potential slowdown. This weakness stems from growing concerns about a global economic recession, the looming threat of a global trade war, and the tightening of chip export restrictions. Consequently, the future performance of this sector hinges heavily on the policy decisions of the incoming administration.
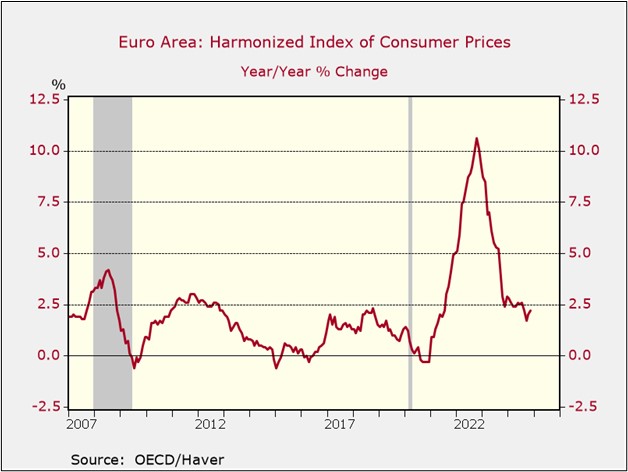
Argentine Inflation: President Javier Milei intends to decelerate the monthly devaluation rate of the Argentine peso (ARS). He has implemented stringent currency and capital controls as a strategy to mitigate rapid currency depreciation and, consequently, curb inflationary pressures.
- Milei’s unorthodox approach has effectively reduced month-over-month inflation from a peak of 26% in December 2023 to 2.7% twelve months later. This significant progress is likely to encourage investors to take another look at the country as it appears to be on the path to economic sustainability.
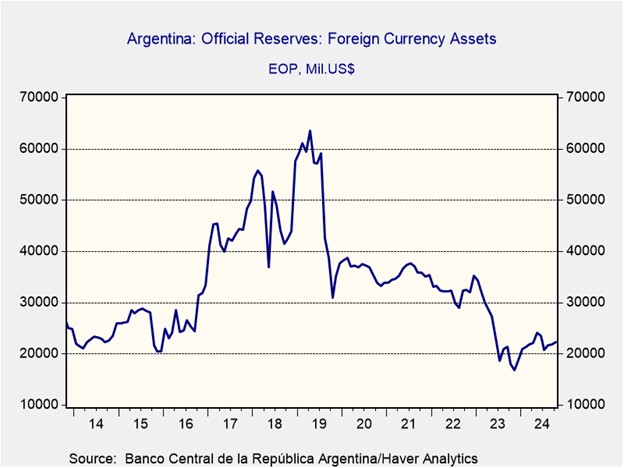
- A crucial next step for the country will be for the central bank to rebuild its foreign currency reserves. This will serve as a key indicator of the long-term effectiveness of the implemented policies.
President In Custody: South Korean President Yoon Suk Yeol was arrested on Tuesday after repeatedly refusing to cooperate with an investigation into his decision to impose martial law last month. His arrest has eased concerns, as the peaceful nature of his detainment has alleviated fears of an escalating constitutional crisis. In response, the Korean won (KRW) strengthened by 0.2% against the dollar.
OPEC Optimism: The OPEC+ cartel is anticipating increased crude oil demand from India and China by 2026, suggesting a potential openness to lifting production cuts. Although the group’s next meeting is not scheduled until February 3, a growing sense of optimism regarding global economic recovery is emerging among its members. The potential for increased oil supply is likely to exert downward pressure on oil prices.
French Pension Plan: The country’s new prime minister, François Bayrou, has proposed “renegotiating” the controversial pension reform introduced by Emmanuel Macron, which raised the retirement age from 62 to 64. This offer appears to be an olive branch to leftists as he seeks support for passing the budget; however, he has maintained that any changes should not hurt the country’s public finances.