

Author: Amanda Ahne
The 2025 Outlook: A Year of Political and Policy Change (December 20, 2024)
by Patrick Fearon-Hernandez, CFA, Bill O’Grady, Thomas Wash, Daniel Ortwerth, and Mark Keller, CFA
Summary of Expectations | PDF
The Economy
Economic Growth
- We expect the US economy to keep growing throughout 2025, with no recession. However, current growth is only moderate, and because of elevated real interest rates and cooling labor demand, growth could slow in the coming year.
Recession Risk
- As the economy loses momentum, it will become more susceptible to recession from an outside shock, such as a major geopolitical crisis or disruptive policy changes. Therefore, a recession cannot be ruled out entirely.
Inflation & Monetary Policy
- As the economy moderated in 2024, price pressures fell. Nevertheless, recent data suggests inflation may not slow much further. While moderating economic growth will encourage the Federal Reserve to keep cutting interest rates in the near term, sticky inflation may keep policymakers from cutting rates as much as some investors expect.
Continued-but-moderating economic growth, sticky inflation, and limited interest rate cuts lay the groundwork for the asset class returns we expect in 2025.
Election Implications
Balancing Coalitions
- Even though the Republican Party won control of the White House and Congress in the 2024 election, President-elect Trump’s coalition will be hard to manage. Different constituencies in the coalition have dissimilar, and sometimes contradictory, goals. The actual policies put into place will be determined by Trump’s bargaining skills and how he balances their varied interests.
Foreign & Domestic Policy
- Despite this complex and fluid situation, we believe we can make some basic predictions about Trump’s policies. In foreign affairs, we think he will adopt protectionism writ large, i.e., forcing increased defense burden sharing on US allies, while imposing import tariffs to protect US manufacturers and workers. In domestic policy, we expect he will emphasize extending his first-term tax cuts and cracking down, to some extent, on legal and illegal immigration.
Monetary Policy
- While Trump’s actual policies are still in question, the major initiatives that we foresee could conceivably buoy price inflation. If so, they could further discourage the Fed from aggressive rate cuts.
Market Outlook
Our asset class return expectations depend, in part, on our expectations for monetary policy and bond yields. After discussing those factors below, we address US and non-US equities and commodities.
Fixed Income
- TREASURY YIELDS
As of this writing, the US yield curve is either slightly inverted or modestly upward sloping, depending on the calculation methods used. Our modeling suggests the yield on the benchmark 10-year Treasury note will end 2025 little changed from current levels. If the Fed cuts short-term rates very little, as we expect, the yield curve should remain fairly flat in 2025. Government bond returns are therefore likely to be similar to today’s yields. - CORPORATE BONDS
Our modeling suggests US investment-grade corporate bonds are currently a bit overvalued, leaving their yields somewhat low compared with government bonds. Even if government bond yields only modestly change in 2025, as we anticipate, corporates are susceptible to repricing that would weigh on their returns. - HIGH YIELD
Our analysis suggests below-investment-grade corporates are more dramatically overpriced, leaving their yield spread over Treasurys much too low to compensate for their greater risk. These below-investment grade bonds will therefore be even more susceptible to negative repricing in 2025, especially as the Fed moves slowly to cut rates and economic growth slows.
US Equities
- BASE CASE FORECAST
We see a much more positive outlook for US equities. Based on our expectation for continued economic growth, profit margins remaining close to where they are now, and P/E ratios staying at today’s level of about 25.0x, our base case calls for the S&P 500 price index for large capitalization stocks to rise by 10.5% in 2025. We expect the index to end the year at 6,735, with a likely range between 6,500 and 6,800. However, our modeling suggests there is significant upside to the P/E ratio. In a best-case scenario, it could
go as high as 30.0x, boosting the percentage price gain commensurately. - CAPITALIZATION
If US equity prices rise as strongly as our analysis suggests, continuing their current momentum, then sectors and styles that have been outperforming recently may continue to do so. Nevertheless, because of the outperformance of large cap stocks in 2024, we think the better buys will be found among mid-cap and small cap equities. - GROWTH/VALUE
Similarly, the 2024 out-performance of growth stocks has left them relatively expensive versus value stocks, in our opinion.
Foreign Equities
- We continue to believe that the relative performance of non-US equities depends largely on the strength of the dollar. Given the US’s relatively better economic growth, elevated real interest rates, and financial market momentum, we think it will continue to see strong inflows of capital from abroad, boosting the value of the greenback. That, coupled with the incoming administration’s expected protectionist policies, will likely constitute headwinds for foreign stocks.
Commodities
- Finally, we continue to see evidence that global central banks are buying up gold, boosting the yellow metal’s price despite our own modeling that suggests it is already richly priced. Because of central bank buying and increased geopolitical tensions around the world, we think gold and other precious metal prices may rise further in 2025.
- In contrast, other commodities are likely to face a challenging price environment because of slowing economic growth in China, weak demand in other major economies, and ample supplies of some key products (such as crude oil).
Bi-Weekly Geopolitical Report – The 2025 Geopolitical Outlook (December 16, 2024)
by the Confluence Macroeconomic Team | PDF
(This is the final BWGR of 2024; the next report will be published on January 13, 2025.)
Each December, we at Confluence publish our annual Geopolitical Outlook to give readers a sense of the issues that will likely dominate the international landscape in the coming year. We don’t necessarily make predictions in this document. Rather, we aim to alert readers to the probable key issues in the coming year or even beyond. The likely developments we identify aren’t meant to be an exhaustive list. We instead focus on the major big-picture conditions that we believe will deeply affect policy and markets going forward. We list the issues in order of importance.
Issue #1: The Next Evolution of American Hegemony
Issue #2: Less Cohesion in the US Bloc, More Cohesion in the China Bloc
Issue #3: China’s Economic Growth Slows Further, But Not Its Military
Issue #4: European Politics Shift Further to the Right
Issue #5: The Middle East Struggles to Regain Peace
Issue #6: Canada and Mexico Adjust to Trump 2.0
Don’t miss our accompanying podcasts, available on our website and most podcast platforms: Apple | Spotify
The podcast episode for this particular edition is posted under the Confluence of Ideas series.
Confluence of Ideas – #39 “The 2025 Geopolitical Outlook” (Posted 12/16/24)
Asset Allocation Bi-Weekly – #131 “Household Cash Levels and the S&P 500” (Posted 12/9/24)
Asset Allocation Bi-Weekly – Household Cash Levels and the S&P 500 (December 9, 2024)
by the Asset Allocation Committee | PDF
Retail money market levels remain elevated.
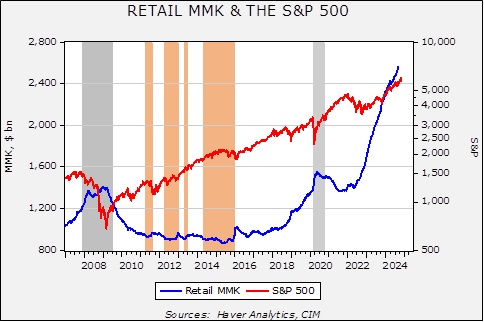
This chart shows the weekly Friday close for the S&P 500 along with the level of retail money market funds. In general, cash being held can either remain held, be used to purchase goods and services, or be used to buy financial or real assets. If the liquidity isn’t available, it doesn’t necessarily mean goods and services or financial assets can’t be purchased. It does mean, however, that some lender must provide funds for the purchase or some other asset must be sold to provide the liquidity. On the other hand, if cash is available, it makes the conversion easier. Since 2022, the level of money market funds has soared. Despite these high levels of money market funds, the S&P 500 has continued to move higher.
Note that after both the 2009 lows and the post-pandemic recession, we saw a rally in equities and a corresponding decline in money market funds, suggesting the rallies were supported by using the liquidity of money market funds to buy stocks. The areas in orange on the chart show how equity market uptrends tend to stall when retail money market levels decline to around $940 billion.
One of the often-heard comments in the financial media is that equities will be supported due to the elevated levels of liquidity available. However, there is an issue with this statement: How does one determine “elevated”? The usual way is to scale the level of liquidity to some other relevant variable. It is not uncommon to scale the level of retail money market funds to stock market capitalization; this would tell you where the level of cash is relative to the overall equity market. By this measure, the level of retail money market liquidity is unremarkable. However, this may not be the best way to scale this variable. Since cash could be spent on goods and services, it might make sense to measure cash levels against spending. If cash levels are low relative to spending, it may suggest that this liquidity won’t be used for financial assets but to support future spending.
Another complicating issue is that there is a clear divergence in asset allocation and income classes. The top quintile is the only one in the US that has its largest allocation in equities. The remainder of the income classes have residential real estate as their primary asset. Thus, focusing on the cash available to the top quintile is likely to have the greatest impact on equity markets.
The level of cash by income quintile is made available in the Federal Reserve’s Financial Accounts of the US, often referred to as the flow of funds account. To scale this cash, we then looked at the past four decades’ average consumption by quintile.
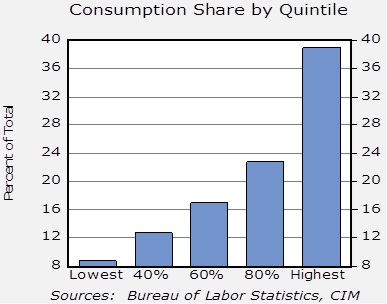
Although poorer households have the largest marginal propensity to consume, the top 40% of households represent over 60% of consumption.
In the next step, we compared the level of cash of the top quintile to their average consumption. This gives us a sort of “velocity” measure of their spending. The lower the velocity, the more cash available for financial assets.
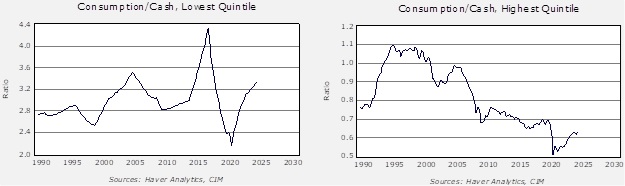
For the lowest quintile, the cash level to consumption ratio fell moving into the pandemic, then rose steadily, suggesting a rather high level of consumption relative to cash. This may account for the low level of sentiment about the economy as recently noted in the political media. Compare that to the highest quintile on the right graph. The spending to cash ratio has been steadily declining and, at current levels, suggests more-than-ample liquidity for purchasing financial assets (or, to be fair, more goods and services).
Overall, we conclude that the level of liquidity will likely be a supportive factor for financial assets, including equities. Obviously, there are several factors that will determine how this cash might be deployed. For example, the cash might find its way into private markets, or if cash yields are attractive enough, it may simply “stay put.” However, with the Fed easing monetary policy, the odds are increasing that this liquidity will find its way out of cash. Thus, investors should be prepared that the equity markets, which appear richly valued at present, could become even more overvalued.
Business Cycle Report (December 5, 2024)
by Thomas Wash | PDF
The business cycle has a major impact on financial markets; recessions usually accompany bear markets in equities. The intention of this report is to keep our readers apprised of the potential for recession, updated on a monthly basis. Although it isn’t the final word on our views about recession, it is part of our process in signaling the potential for a downturn.
The Confluence Diffusion Index rose above the recovery indicator for the first time since February 2023. However, the October report showed that six out of 11 benchmarks remain in contraction territory. Last month, the diffusion index improved slightly from -0.1515 to -0.0909 and is above the recovery signal of -0.1000.
- Interest rates picked up, which helped normalize the yield curve.
- Construction and manufacturing activity slowed.
- Labor market conditions were negatively impacted by hurricanes.
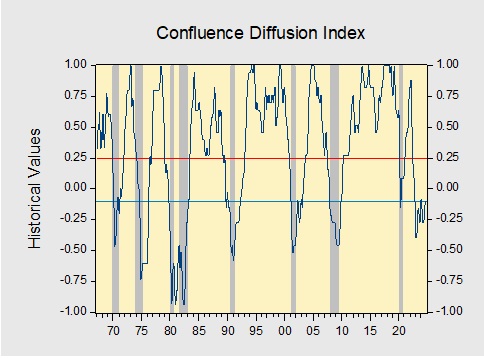
The chart above shows the Confluence Diffusion Index. It uses a three-month moving average of 11 leading indicators to track the state of the business cycle. The red line signals when the business cycle is headed toward a contraction, while the blue line signals when the business cycle is in recovery. The diffusion index currently provides about six months of lead time for a contraction and five months of lead time for recovery. Continue reading for an in-depth understanding of how the indicators are performing. At the end of the report, the Glossary of Charts describes each chart and its measures. In addition, a chart title listed in red indicates that the index is signaling recession.
Asset Allocation Bi-Weekly – #130 “Bonds and the Post-Election Environment” (Posted 11/25/24)
Asset Allocation Bi-Weekly – Bonds and the Post-Election Environment (November 25, 2024)
by the Asset Allocation Committee | PDF
The election results are in and, contrary to expectations, voters rendered a quick and clear outcome, with Donald Trump set to return to the White House. The central case prior to the election was that the outcome would be drawn out and contentious — an outcome that would tend to support flight-to-safety assets, such as long-dated Treasurys. However, in the wake of the actual outcome, a reassessment is in order.
Our analysis of the long end of the yield curve starts with our yield model.
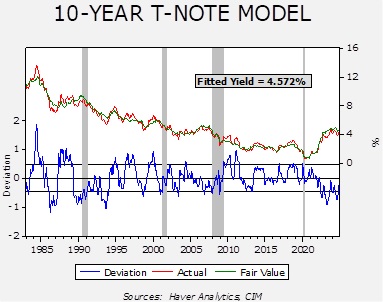
The model’s independent variables include the level of fed funds, the 15-year average of CPI yearly inflation, the five-year standard deviation of inflation, WTI oil prices, the yields on German and Japanese 10-year sovereign bonds, the yen/dollar exchange rate, the fiscal deficit scaled to GDP, and a binary variable for government control. As the model shows, yields are running below fair value but are within the expected range of outcomes.
As the election approached, despite the general consensus of a close race among the political pundits, the markets began to expect a GOP presidential win with a strong possibility of legislative control as well. In mid-September, the constant maturity 10-year T-note yield was 3.63%; it has increased to 4.45% in the wake of the election results.
A key issue is whether the yields will continue to rise in the coming weeks. Here are the factors we are watching:
- Our model’s government binary variable adds 30 bps to the fair value yield when there is a unified government. Since 1983, a situation where a single party controls both the executive and legislative branches usually results in greater spending and potentially higher deficits. We don’t apply that variable until the new legislature is seated, so we have not activated that variable quite yet. This variable will be in effect in January, though, which suggests there will be a bias toward higher yields.
- When yields peaked above 5% in late October 2023, the Treasury and the Federal Reserve acted in concert to bring yields lower. The Treasury adjusted its borrowing to the short end of the yield curve and Chair Powell signaled that the policy rate had peaked and was poised to decline. These actions sent yields lower to around 3.8% by late December 2023. Given that the current government is in “lame duck” status, we doubt that the Treasury will engage in similar behavior now. Thus, there will likely be greater tolerance for rising 10-year yields. In other words, although the Fed and the Treasury had signaled earlier that a 10-year yield above 5% was intolerable, that likely isn’t the case now.
- Since the recent FOMC decision to cut 25 bps, another similar cut at the mid-December meeting is mostly expected by the markets. The unknown is what future policy will look like in the wake of recent political developments. A model based on the difference between overall yearly CPI and unemployment (an approximation of the Phillips curve) would suggest that the current policy rate is near neutral.
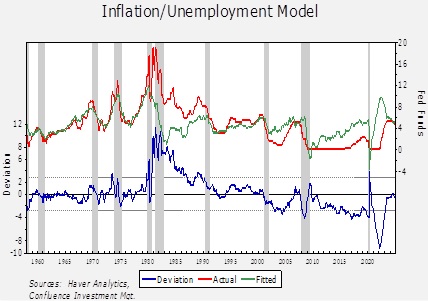
Anything beyond the anticipated 50 bps of cuts before year’s end will begin to move monetary policy into easing mode, which will be difficult to justify without a rapid weakening of the labor market or a drop in inflation. Without further cuts, it will be difficult for long-term yields to decline significantly.
Once President-elect Trump assembles his team at the Treasury, we could see action similar to what occurred in October 2023 to bring down long-duration Treasury yields. However, until then, there is a window where yields could rise to uncomfortable (e.g., >5%) levels. Thus, we believe investors should exercise care in extending on the yield curve into next year.