by the Asset Allocation Committee | PDF
In recent years, tariffs have made a surprising comeback. Once widely condemned as a relic of the protectionist past, tariffs reemerged in 2016 as a policy tool against China and are now being considered for implementation on goods from all other countries. Populists tend to believe that these tariffs can be used to address a range of domestic economic issues, including persistent trade and fiscal deficits. They also generally believe that by leveling the playing field for domestic industries, tariffs can ultimately boost living standards for American households.
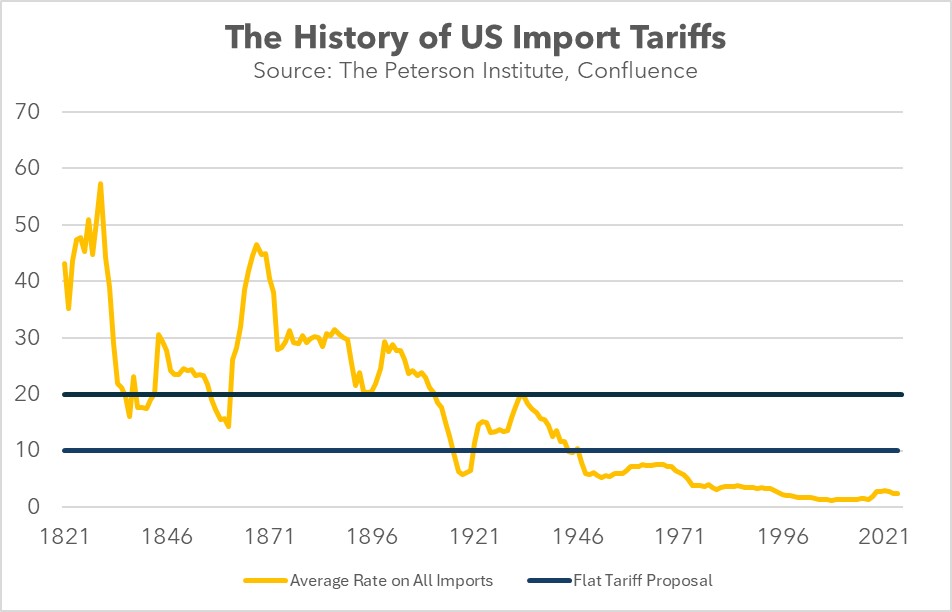
Under the new proposal, the US would impose a blanket tariff of 10% to 20% on all imports, with additional tariffs of 60% to 100% on goods from China. This would significantly increase the US’s average tariff rate to its highest level in nearly eight decades. The primary goal would be to protect US manufacturers and incentivize foreign companies to shift factory operations to the US, thereby creating domestic jobs. Furthermore, proponents believe that the increased tariff revenue could help reduce the US federal budget deficit. This proposed strategy has resonated with a substantial portion of the American electorate.
Despite its popularity with certain segments of the population, the proposal has faced significant opposition as it contradicts conventional economic wisdom. A tariff is a tax imposed on imported goods. Typically, it is levied as an ad valorem tax, which means it is calculated as a percentage of a good’s value. For instance, if the tariff rate were 10%, then importing a car valued at $10,000 would require paying a tariff of $1,000.
The potential increase in import costs has raised concerns about the proposal’s impact on price inflation. While businesses initially bear the cost of import tariffs, they can often pass a significant portion of this cost onto consumers in the form of higher prices. This economic phenomenon, known as tariff pass-through, is particularly prevalent for goods where businesses have significant pricing power. However, the extent to which tariffs can contribute to inflation and impact the overall economy varies.
When US consumers and businesses purchase foreign goods by paying in dollars, the foreign seller typically will exchange the greenbacks received for their own currency in the foreign exchange market. Therefore, increased US demand for foreign goods should lead to increased demand for foreign currencies, which in turn could weaken the US dollar. However, foreign countries often recycle their dollar holdings back into the US economy, in which case the foreign inflow can paradoxically buoy the dollar and widen the US trade deficit, or at least limit the dollar depreciation and the narrowing of the deficit.
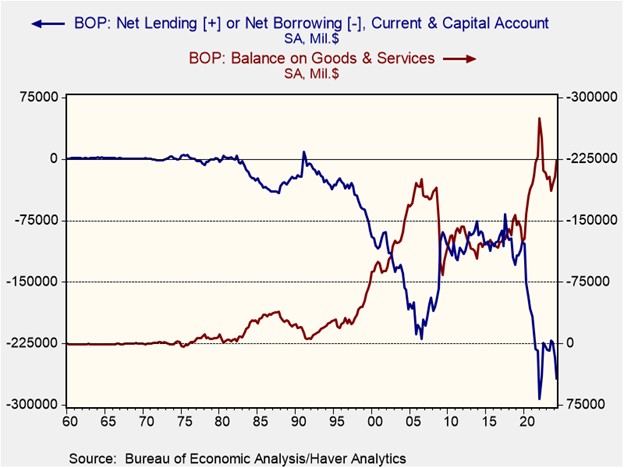
For a flat tariff to successfully reduce trade and fiscal deficits without exacerbating inflation, the US would need to transition from a consumption-driven economy to an export-oriented one. US consumers would need to scale back their demand for tariff-laden imports and/or US producers would need to increase their exports. This shift would require the US to reduce its reliance on borrowing and become a net lender to the global economy. By increasing exports, the US could offset the negative impacts of tariffs and strengthen its economic position. Countries, like China, have achieved this transformation by implementing policies that encourage saving and discourage consumption, often at the expense of social safety nets.
The US dollar’s dominance as the global reserve currency could hinder an export-led growth strategy. Historically, large US trade deficits have supported the dollar’s role as other countries have relied on it for international transactions. To shift this dynamic, the US might need to diminish the dollar’s appeal. This could involve implementing capital controls, as many developing countries do, in order to restrict cross-border capital flows. Alternatively, the US could sacrifice monetary policy autonomy, either by pegging the dollar to another currency or by joining a currency union with other nations.
Because we don’t expect the US to make all the necessary adjustments to become more export-oriented, we believe that potential tariffs could induce foreign countries to devalue their currencies to offset the impact of the tax levy. Accommodative monetary policy could make this possible. This scenario would benefit US companies with limited foreign revenue, such as small and mid-cap companies, as their revenues would likely remain unaffected by currency depreciation. However, this could negatively impact US exporters that rely on foreign sales as the price of their goods could become less competitive.
View PDF