by Patrick Fearon-Hernandez, CFA, and Thomas Wash
[Posted: 9:30 AM ET] | PDF
Good morning! Markets are still grappling with the ongoing Middle Eastern conflict. Today’s Comment will analyze the escalating Israel-Iran tensions, explore the reasons behind the positive surprise from JOLTS, and provide our perspective on the recent vice presidential debate. Finally, we’ll conclude with a roundup of key domestic and international economic data.
Israel-Iran: The two countries have launched attacks against one another in a sign that tensions in the Middle East are rising.
- Iran launched a massive barrage of 180 ballistic missiles against Israel on Tuesday, hours after the White House issued a stern warning about potential Iranian retaliation for a ground incursion into Lebanon. While most of the missiles were intercepted, the recent rocket launches penetrated farther into Israeli territory and came with less warning than the previous attack in April. So far, there is uncertainty as to whether tensions will escalate further, with Israeli Prime Minister Benjamin Netanyahu vowing that Iran “will pay” for the attack and Iran insisting that it is not interested in a broader war.
- The recent attack on Israel has triggered a sharp spike in oil prices, with Brent crude climbing above $75 a barrel — a level not seen since August. While the immediate impact of the attack is clear, the longer-term price trajectory remains less certain. Before the incident, the two warring factions in Libya agreed to a compromise, paving the way for a resumption of oil exports. Meanwhile, the Saudi-led OPEC+ alliance is scheduled to convene today to discuss increasing its production target. As a result, the potential increase in supply is likely to keep oil prices in check.
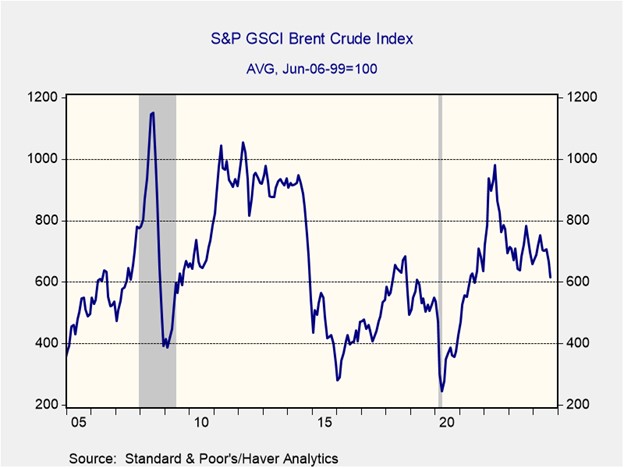
- The extent to which the conflict escalates will significantly influence oil prices. A broader war, involving Israeli strikes on Iranian oil infrastructure or an Iranian blockade of the Strait of Hormuz, could drive crude prices substantially higher. Currently, there is no indication that either side is seeking a major escalation. The US and its allies are actively working to de-escalate the situation. However, Israel’s recent denial of entry to UN Secretary-General António Guterres has raised concerns about its willingness to reduce tensions.
Job’s Surprise: Job openings surged in August; however, there are still signs that the labor market is cooling.
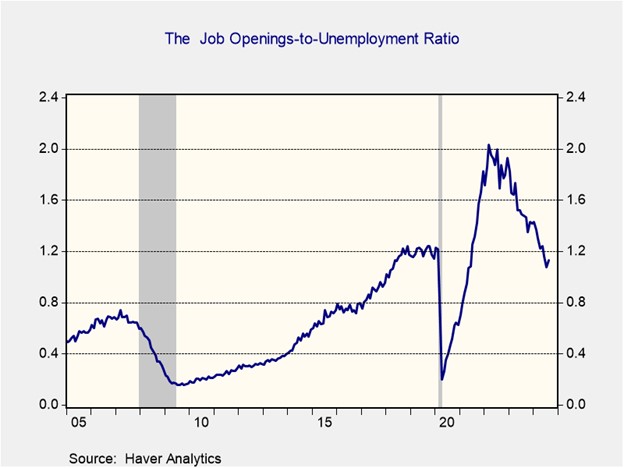
- The Job Openings and Labor Turnover Survey (JOLTS) revealed a surge in job openings in August, reaching a three-month high of 8.04 million. This uptick was primarily fueled by increased openings in construction and state and local government sectors. Despite the rise in available positions, concerns persist regarding labor demand. Hiring rates dipped to 3.3%, equaling their lowest point since the pandemic began. The number of job openings to the number of unemployed ratio was held to a three-year low of 1.1, down from the post-pandemic peak of 2.0 and slightly below the pre-pandemic ratio of 1.2.
- The mixed JOLTS report has muddied the waters on the labor market’s true health. The rise in construction jobs was likely fueled by lower interest rates, reflecting expectations of Fed cuts. The 10-year Treasury yield declined by nearly 50 basis points from early July to late August. Although this did not lead to an increase in construction spending, there was a noticeable rise in activity, particularly in housing starts. However, sectors less sensitive to interest rate changes, such as retail trade and transportation, experienced noticeable declines, which is likely to reinforce concerns that hiring is cooling.
- The size and timing of the Fed’s next rate cut will be heavily influenced by the jobs report, which will be released on Friday. While the JOLTS report was broadly positive, other surveys released last month have predominantly flashed warning signs that the labor market is cooling. If the BLS jobs report shows a slowdown in job creation or another uptick in the unemployment rate, Fed officials may seek to adjust policy to ensure that they do not lose control over the maximum employment mandate.
Vice Presidential Debate: The contest between the two vice-presidential candidates may not have produced sound bites, but it offered both sides a strong platform to share their visions for the country.
- During the debate, both sides tried to highlight the qualifications of their respective presidential candidates. Senator JD Vance argued that former President Donald Trump helped to lower inflation to 1.5% and increase take-home pay for American families while he was in office. Meanwhile, Minnesota Governor Tim Walz argued that Vice President Kamala Harris had helped lower insulin prices and had passed much-needed infrastructure legislation. Neither candidate made a significant impact, but they did not make any major mistakes either.
- With 33 days remaining until the election, there doesn’t appear to be a clear front-runner, which is different from previous election cycles. In the last election, President Joe Biden was considered the comfortable favorite to win the presidency and enjoyed very favorable polling. However, this year, the polls have tightened considerably, with Harris trailing broadly across swing states, according to data collected by Real Clear Politics.
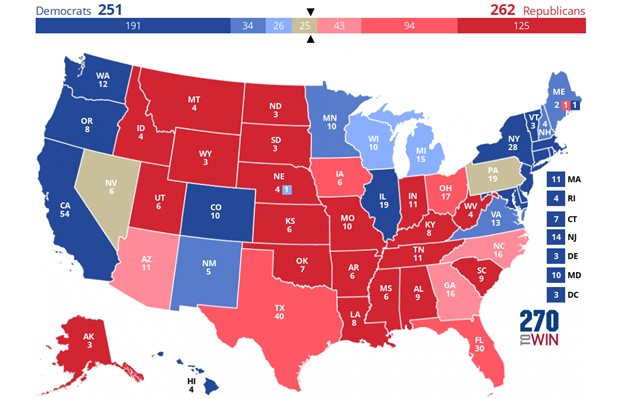 (Source: www.270towin.com and Polymarket)
- While Ohio Senator JD Vance appeared the most poised and composed during the debate, the lack of viral moments may render the contest inconsequential to the election. According to our current electoral forecast, based on betting odds, the election is likely to be a toss-up, potentially coming down to Pennsylvania. Betting odds slightly favor Harris, although polling shows an advantage in the other direction. It’s important to note that the president’s impact on financial markets is not as significant as that of the legislative branch, with betting odds currently favoring a split Congress.
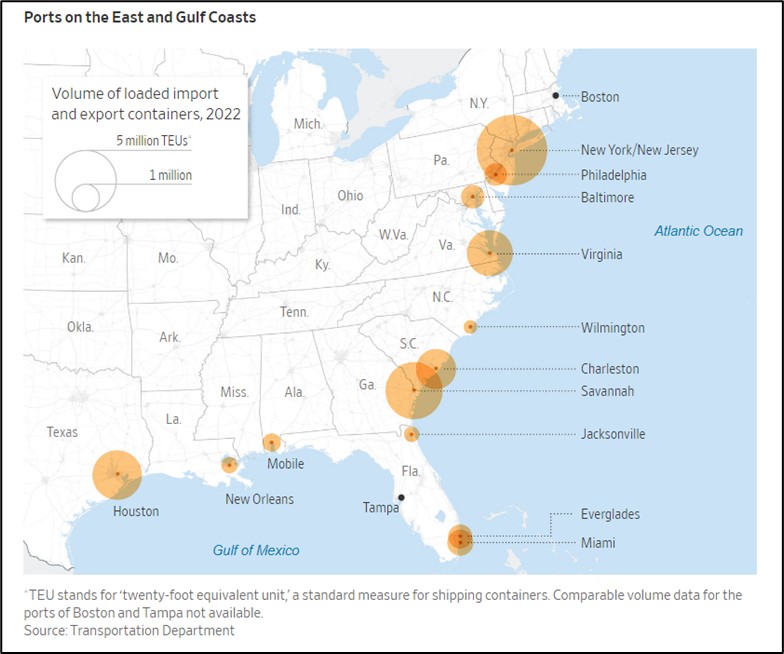
In Other News: French Prime Minister Michel Barnier has proposed raising taxes to address the country’s debt, indicating a move towards unpopular measures. At the same time, dockworkers in the US have gone on strike, which could potentially disrupt US supply chains. Additionally, UK Prime Minister Keir Starmer is heading to Brussels to help improve relations with the EU as the two sides seek to secure deals on defense and food.