

Author: Amanda Ahne
Asset Allocation Bi-Weekly – The Benjamin Button Dividend (September 16, 2024)
by the Asset Allocation Committee | PDF
A company’s journey to industry prominence typically involves several stages: launch, growth, shakeout, maturity, and decline. Historically, large capitalization stocks were often considered to be in the maturity stage of their development. Many investors therefore assumed that these companies had strong enough earnings to initiate or maintain dividend payments, making them seem more attractive than their smaller counterparts that were primarily considered for their capital gains potential. However, recent trends suggest that times have changed.
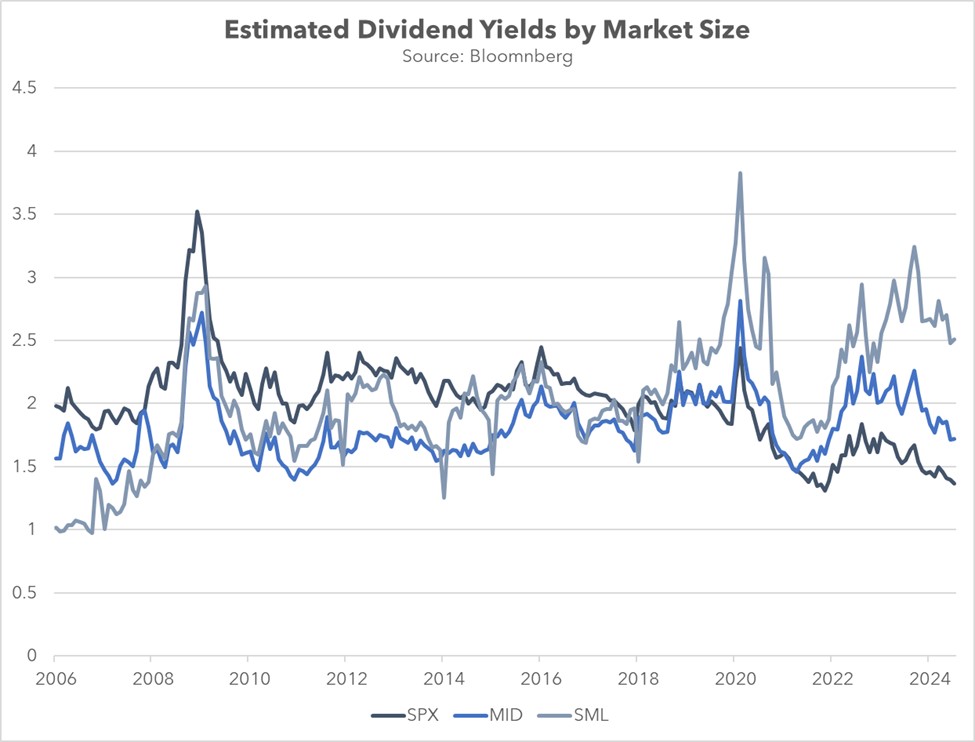
Over the past seven years, small cap stocks have consistently surpassed their mid-cap and large cap counterparts in terms of estimated dividend yields. This gap can be attributed to both relative price appreciation and dividend policy. During this period, the large cap S&P 500 stock price index grew nearly twice as fast as the mid-cap S&P 400 price index and the small cap S&P 600 price index. Additionally, small firms have significantly increased their dividend payout ratios relative to their larger peers, from just under 40% to over 60% in the last decade. In contrast, large cap firms have maintained relatively stable dividend policies over the same period.
The primary shift in the relationship between the small cap and large cap indexes has been driven by a changing sectoral composition, largely due to the survivorship and maturation of technology companies. As smaller tech companies have grown and become more successful, they have been rebalanced into the large cap index or were bought out. Meanwhile, those that failed to move up were removed. This dynamic has led to a significant increase in the weight of the tech sector within the large cap index at the expense of the small cap index.
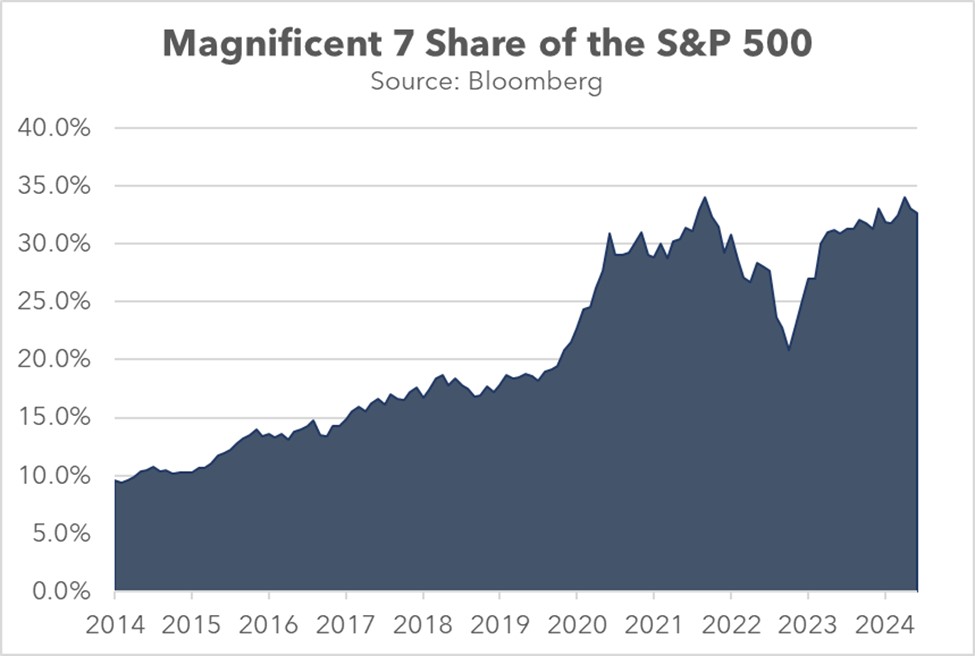
Over the past decade, information technology and communication companies have significantly increased their share of the large cap S&P 500 index, rising from 22.0% to 39.0%. In contrast, the small cap S&P 600’s exposure to tech companies has declined from 20.0% to 16.5%. As a result, the broad large cap index now exhibits more growth-like characteristics than its smaller counterparts. The S&P 500’s price-to-earnings ratio of 25.1 is substantially higher than those of the S&P 400 and S&P 600, which are each around 19.0. Moreover, the large cap index has become increasingly susceptible to price fluctuations in a select group of companies.
While tech companies have lost share within the small cap index, financial services and real estate firms have largely filled the void. Their rise was driven in part by low interest rates, which incentivized investors to seek assets with capital gains potential. This preference led to a surge in demand for large cap tech companies, which were perceived to have strong growth potential, at the expense of financial services and real estate firms, which paid dividends but were seen as less likely to appreciate significantly over time.
The substantial increase in the small cap index’s exposure to the Financials and Real Estate sectors is primarily attributable to reclassifications. Beginning in 2018, larger financial and real estate firms began to decline in market value, leading to their reclassification from the S&P 500 to the S&P 400. This trend intensified following the pandemic as many of these companies experienced further declines and they then made their way into the S&P 600.
These changes have resulted in a relative increase in the number of firms paying out substantial dividends within the small cap index. Over the past six years, the S&P 600’s exposure to financial and real estate companies has increased from 22.1% to 27.6%, while the S&P 500’s share has decreased from 17.6% to 15.7%. The S&P 400 saw a slight decline from 26.1% to 25.0% in its holdings of these sectors. Notably, the small cap index now has as many financial services and real estate firms as the large and mid-cap indexes had combined just 10 years ago.
Contrary to popular belief, a company’s size is not a reliable indicator of maturity. In fact, the average lifespan of S&P 500 companies has dramatically decreased in recent decades. The influx of tech companies into the large cap space has further accelerated this trend. In 1984, the average company survived 36 years, whereas today that figure is barely over 18 years. To put it into perspective, these companies are barely old enough to vote and not yet old enough to drink. This shorter tenure may explain why larger firms often exhibit less mature behavior than some of their smaller, dividend-paying counterparts, which have a weighted average lifespan of at least 32 years. In sum, investors seeking dividend income may now need to focus more on small cap companies than they did in the past.
Confluence of Ideas – #37 “Reviewing the Asset Allocation Rebalance: Q3 2024” (Posted 9/11/24)
Business Cycle Report (August 29, 2024)
by Thomas Wash | PDF
The business cycle has a major impact on financial markets; recessions usually accompany bear markets in equities. The intention of this report is to keep our readers apprised of the potential for recession, updated on a monthly basis. Although it isn’t the final word on our views about recession, it is part of our process in signaling the potential for a downturn.
The Confluence Diffusion Index remained in contraction. The July report showed that seven out of 11 benchmarks are in contraction territory. Last month, the diffusion index fell slightly from -0.2727 to -0.2818, below the recovery signal of -0.1000.
- Fed rate cut speculation helped push down interest rates.
- The goods-producing sector showed slight improvement but remains weak.
- The labor market showed signs of deterioration.
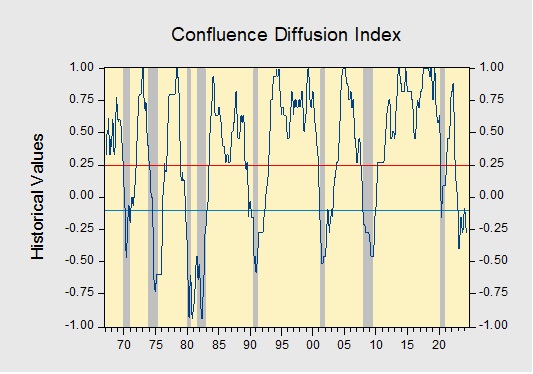
The chart above shows the Confluence Diffusion Index. It uses a three-month moving average of 11 leading indicators to track the state of the business cycle. The red line signals when the business cycle is headed toward a contraction, while the blue line signals when the business cycle is in recovery. The diffusion index currently provides about six months of lead time for a contraction and five months of lead time for recovery. Continue reading for an in-depth understanding of how the indicators are performing. At the end of the report, the Glossary of Charts describes each chart and its measures. In addition, a chart title listed in red indicates that the index is signaling recession.
Asset Allocation Bi-Weekly – #124 “Activist vs. Accommodative Treasury Issuance” (Posted 8/26/24)
Asset Allocation Bi-Weekly – Activist vs. Accommodative Treasury Issuance (August 26, 2024)
by the Asset Allocation Committee | PDF
The Federal Reserve and the US Treasury are independent government agencies with the shared objective of economic prosperity. While the Treasury manages government finances and executes fiscal policy, the Fed focuses on monetary policy as it aims to maintain price stability and full employment. Despite the Fed and the Treasury having distinct roles, there is an ongoing debate over whether they should coordinate their policies or whether it’s appropriate for one to work at cross-purposes with the other, particularly in the context of the big US budget deficit and growing debt load.
A recent report has accused the Treasury of intentionally shifting its debt issuance strategy to favor shorter-term bills over longer-term notes to the detriment of the country. Economists Nouriel Roubini and Stephen Miran, both Treasury veterans, contend in their paper, “ATI: Activist Treasury Issuance and the Tug-of-War Over Monetary Policy,” that this strategy is a deliberate attempt to counteract the Fed’s tightening measures and artificially stimulate the economy.
The Roubini and Miran paper argues that the Treasury’s strategy effectively amounts to a covert form of quantitative easing (QE). When the Fed employs QE to stimulate the economy, it purchases long-term bonds, thereby suppressing interest rates. The Treasury can achieve a similar outcome by shifting toward shorter-term debt issuance. By reducing the supply of longer-term bonds, the Treasury can indirectly push up their prices and lower their yields, effectively loosening financial conditions.
Roubini and Miran contend that the Treasury’s shift toward more bill issuance has counteracted the Fed’s effort to tighten monetary policy, contributing to the robust economic growth and elevated inflation seen in Q1 2024. According to Roubini and Miran, Treasury bills serve as a near-cash asset, enabling financial institutions, institutional investors, and corporations to secure loans by using them as collateral. In essence, the issuance of new Treasury bills can amplify the money supply through the money multiplier effect, which increases market liquidity.
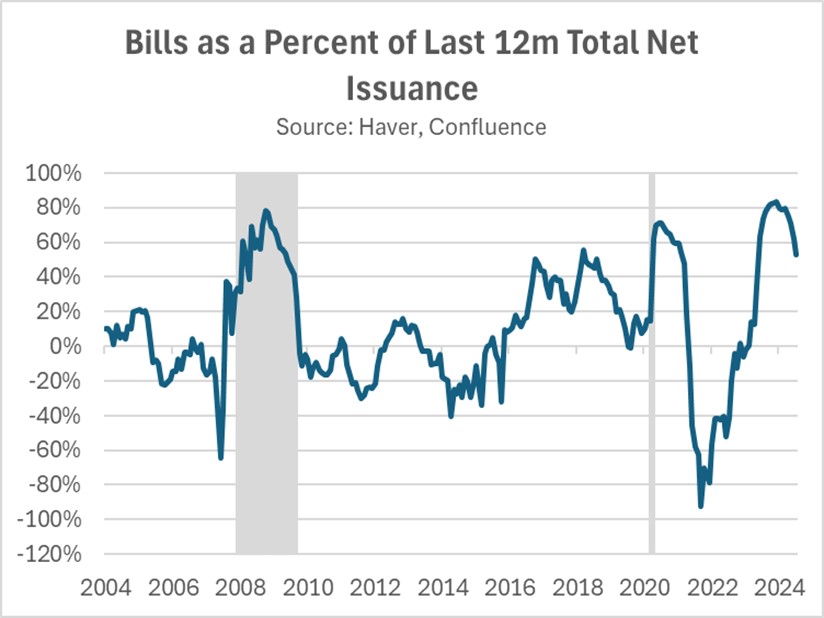
While they acknowledge the typical shift toward shorter-term Treasury issuance in economic downturns, Roubini and Miran argue that the current pronounced bias for bills over notes is exceptional and may be politically motivated. By prioritizing bill issuance, the Treasury may have sought to avert a surge in long-term interest rates typically associated with bond sales. This strategy is credited with contributing to a decline in 10-year yields, which, in turn, has fueled risk appetites and inflated stock valuations in the lead-up to the election.
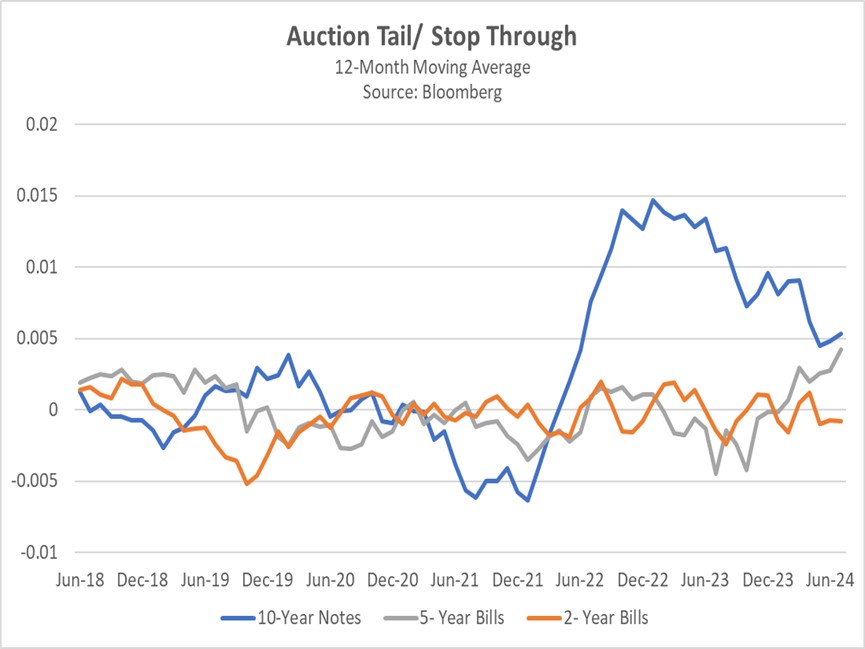
However, an alternative explanation for the Treasury’s issuance reallocation lies in the market’s response to rising interest rates. When the Fed initiated rate hikes in 2022, demand for longer-term bonds weakened due to increased interest rate risk. Conversely, demand for shorter-term Treasury bills surged, primarily driven by money market funds and institutional investors seeking higher yields on short-term assets. This market dynamic is reflected in the results of Treasury auctions, with 10-year bonds consistently undersubscribed and two-year bills frequently oversubscribed.
Moreover, the Treasury’s issuance strategy may not be as counterproductive as Roubini and Miran imply, since the sale of bills has mitigated the need for extraordinary Fed intervention in the economy. Prior to the change, the banking sector faced severe liquidity challenges following the collapse of Silicon Valley Bank in 2023 due to heavy investments in low-yielding, long-duration bonds. As interest rates rose, bond values fell and hindered banks’ ability to use them as collateral to meet short-term cash needs. In response, the Fed established new lending facilities, which helped address the immediate crisis but hampered its balance sheet reduction efforts.
By significantly increasing bill issuance, the Treasury provided the banking system with high-quality collateral, therefore mitigating the risk of a liquidity crunch within the repo market. This buffer has made it easier for the Fed to maintain its policy tightening without hurting the financial system. As interest rates begin to decline, the urgency of this allocation strategy will lessen, leading to a gradual reduction in Treasury bill issuance as a share of total issuance.
Contrary to Roubini and Miran’s assertion, the Treasury’s allocation strategy has actually seemed to support the Fed’s objectives. It has enabled the Fed to prolong quantitative tightening and maintain higher interest rates for an extended period and has increased the likelihood of a soft landing. However, this cooperative stance could potentially embolden the Fed to adopt a more gradual easing path, which would benefit short to intermediate bond yields.
Bi-Weekly Geopolitical Report – The Recent Iranian Election: Results & Implications (August 19, 2024)
by Daniel Ortwerth, CFA | PDF
The Iranian political landscape experienced a major earthquake on May 19, when the country’s president, Ebrahim Raisi, died in a helicopter crash on his return from a visit to neighboring Azerbaijan. Consequently, in June and July, Iran conducted a two-round presidential election with a surprising result. In a country ruled by a highly conservative theocracy, whose political system has become increasingly dominated by its most hardline, right-wing parties, a reformist (i.e., moderate) candidate came out on top. How did this happen, and what does it mean for the rest of the world? Will it inspire changes in Iranian domestic politics or foreign policy? How will it affect the United States, and what does it mean for investors? Since Iran tends to be a disruptive force in the world, these and other questions need our attention.
This report begins with a review of three key challenges currently facing Iran: regional and global opposition to Iran’s long-term geopolitical strategy, deepening economic woes, and an upsurge in societal unrest. We continue with an explanation of the role of the president in the Iranian political structure and a brief introduction to the winner of the election, reformist Masoud Pezeshkian. We conclude with an explanation of why we do not expect this change of leadership to shift Iran’s geopolitical strategy, even if it does usher in adjustments to how it approaches its key challenges. As always, we conclude with implications for investors.
Note: There will be no accompanying podcast for this report.
Asset Allocation Bi-Weekly – Is the Sahm Rule Right? (August 12, 2024)
by the Asset Allocation Committee | PDF
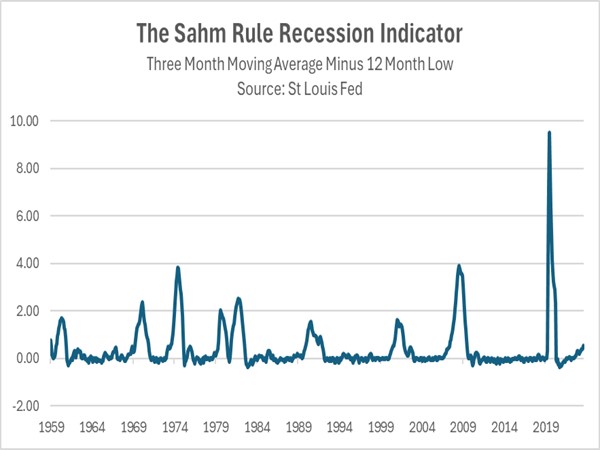
While there has been some speculation that the US economy may be headed for a recession, one indicator suggests it has already begun. The “Sahm Rule,” a widely used metric for determining the early stages of recession, was triggered in July. Created by former Federal Reserve economist Claudia Sahm, this rule posits that the economy is in recession when the three-month average of the unemployment rate rises by at least 0.5 percentage points above its lowest level in the past year. In July, after five straight increases in the unemployment rate, the three-month moving average stood 0.53 percentage points above its low point over the last year. However, while the indicator has a strong track record of signaling when the economy is in recession, this time might be different.
The Sahm Rule is a coincident recession measure, but other data suggests that the economy remains firmly in expansion as opposed to contraction. For example, the unemployment rate currently stands at 4.3%, below the noncyclical rate of 4.4%, and therefore still indicates full employment. Moreover, the latest report on gross domestic product showed that growth accelerated from an annualized rate of 1.4% in the first quarter to 2.8% in the second quarter. That contradicts the technical definition of a recession, which requires two consecutive quarters of economic contraction.
Doubts about the Sahm Rule’s veracity become more apparent when looking at the underlying drivers of the recent increase in joblessness. The reported increase was fueled in part by a dramatic surge in the number of people entering the civilian labor force — workers and those seeking employment. Notably, the number of new and re-entering workers has expanded by nearly 17% from a year ago, a sharp reversal from the pre-pandemic downtrend. Immigrants filling job vacancies were a strong driver of this growth, although women and retirees also contributed significantly to the increased labor force participation.
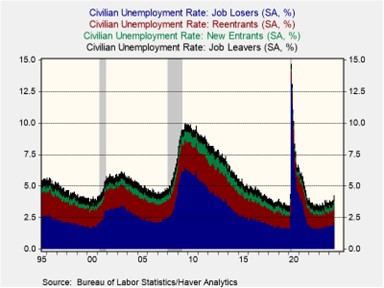
All the same, there are worrying signs within the labor market data. Job creation has decelerated sharply since the year began, with no net new hires in July compared to the previous year. Concurrently, job openings have been declining since 2022, and initial jobless claims are on an uptrend. Furthermore, while the share of job losers remains near historical averages, it has recently shown signs of increasing.
The Sahm Rule’s activation is a notable indicator of a cooling labor market. However, declaring a recession based solely on this metric would be premature, given overall employment levels and other indicators showing many economic sectors are still growing. Nevertheless, recent data may prompt the Fed to ease monetary policy more aggressively to prevent a hard landing. Consequently, an interest rate cut in September of 50 basis points now looks possible, with subsequent easing contingent on incoming data.
Note: There will not be an accompanying podcast for this report.
Bi-Weekly Geopolitical Report – The US Geopolitical and Economic Bloc as an Investment Region (August 5, 2024)
by Patrick Fearon-Hernandez, CFA | PDF
More than a decade ago, we at Confluence began describing how United States voters have become more reluctant to shoulder the costs of global hegemony. We’ve shown how increased populist isolationism in the US and other Western nations helped embolden Chinese General Secretary Xi, Russian President Putin, and other revisionist authoritarians to become more assertive in their efforts to undermine the US-led world order. As the resulting geopolitical tensions prompted leaders around the world to seek military, economic, and cultural allies to preserve their security and prosperity, we noted a clear fracturing of the world into relatively separate geopolitical and economic groups or “blocs.” We think this global fracturing is bound to have big implications for investors.
To better understand the new blocs and gauge how they might impact investors, we developed an objective, quantitative method to predict which bloc a country would adhere to in the coming years. We first published our findings in our Bi-Weekly Geopolitical Report from May 9, 2022. In our report today, we update the analysis. We will also do a deep dive into the attractiveness of the US bloc as an investment region, the prospects for the bloc staying together after the US elections in November, and the implications for investment strategy.