by the Asset Allocation Committee | PDF
The standard regression model is as follows:
Y = α +β(X) + ε
Where Y is the dependent variable, X is the independent variable, α is the intercept, β is slope and ε is the error term. No model, no matter how many independent variables are added, can capture the complete relationship to the dependent variable. However, a well-constructed model will account for most of the variation in the behavior of the dependent variable.
Although it tends to get short shrift in statistics classes, the error term is rather interesting, especially with regard to time series models. Essentially, the error term, or epsilon, is where the unspecified causal factors that affect the dependent variable are housed. The goal of modeling is to select the most meaningful independent variables and then assume the ones that are not specified are not important enough to dramatically affect the dependent variable. It may be that the unspecified terms are not all that important, or if they are, they are offset by other unspecified variables so that the model’s performance isn’t adversely affected.
Sometimes, a dependent variable begins to exhibit deviations to the model’s estimate; this may be caused by several factors. One is that the relationship between an already specified independent variable and the dependent variable has changed. The relationship may have rested on some other factor, such as policy, that has made it more or less important. Over time, the β, or the correlation coefficient, will adjust to this new relationship. In other cases, a previously unimportant variable, contained in epsilon, becomes important.
We think this latter situation is affecting the gold market.
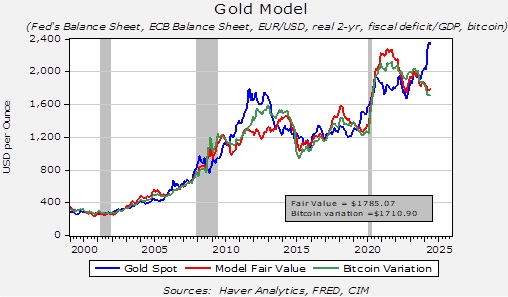
The chart above is our basic gold price model. As the chart shows, the model’s estimation occasionally deviates from the actual price. If nothing has changed, this deviation may suggest an over or undervalued market. The recent spike in gold prices is clearly running well above our model’s estimation. However, we think we have isolated a change that accounts for this deviation.
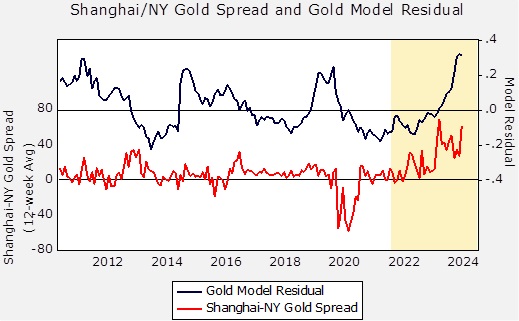
The upper line on the above chart shows the model’s residuals since 2012. The lower line shows the spread between gold prices in Shanghai and New York. The history of this spread shows some deviation, but in general, this condition invites arbitrage if prices are higher or lower in one market compared to the other. Note that the New York prices far exceeded those in Shanghai during the pandemic. We can assume the mechanisms for arbitraging that market were disrupted by the pandemic, and the spread narrowed when these mechanisms returned. The area on the chart above in yellow indicates the Russian invasion of Ukraine. Note that gold prices in Shanghai have been persistently elevated relative to those of New York.
The G-7 implemented sanctions on Russia in the wake of the invasion, and perhaps the most draconian of those was the move to freeze Russian foreign reserves. This move raised fears in other nations that if they were to see relations with the US deteriorate, then similar actions might be deployed against them as well. So, in response, foreign governments have been increasing their gold purchases. Since the Chinese are concerned about the vulnerability of their massive US Treasury holdings, it appears they have been aggressively buying gold to the point where the Shanghai price has been persistently above the New York price.
It’s still too early to determine what impact this spread relationship will have on the overall gold price in the future, but this situation is a good example of when a previously quiescent variable, well contained in epsilon, suddenly becomes important. Faced with a model that is deviating from its past performance, the challenge for the analyst is to determine the cause. We believe that Asian buying, both from central banks and private investors, is the cause in this case. This condition could mean that when traditional bullish conditions for gold return (e.g., lower interest rates, weaker dollar, central bank balance sheet expansion), the price of gold could move sharply higher, bolstered by this new factor — enhanced Asian buying.
View PDFAAW_Jul_15_2024