

Author: Amanda Ahne
Asset Allocation Bi-Weekly – The Importance of the Federal Reserve’s Inflation Target (May 28, 2024)
by the Asset Allocation Committee | PDF
Money has three characteristics: medium of exchange, store of value, and unit of account. When money is taught in undergraduate economics classes, these three functions are treated as self-evident, but careful observation suggests that that the first two characteristics are contradictory. If a monetary authority emphasizes the medium of exchange function, then it will tend to oversupply specie to the economy. If the store of value function is favored, then currency is restricted, which tends to support the value of money at the expense of consumption.
In practice, monetary authorities must balance these goals. However, these authorities don’t exercise policy in a vacuum. Instead, the dominating factor usually reflects the power structure of a nation. A society dominated by creditors and asset owners tends to favor the store of value function, whereas one dominated by debtors and consumers favors medium of exchange. Throughout history, monetary authorities have usually either adopted a gold standard, which tends to favor the store of value function, or a fiat standard, which means the currency’s value is set by the central bank’s control of the money supply. Throughout history, a fiat standard tends to favor the medium of exchange function.
Price levels should reflect which factor the policymakers favor. This chart details the CPI index relative to historical monetary regimes.
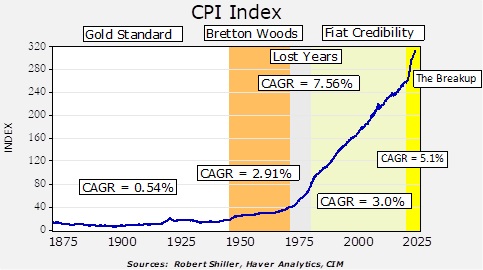
Our data series begins in 1871. From the founding of the republic until 1944, the US was on a gold standard for the majority of the time. During wars, the gold standard was usually suspended, but the government tended to return to it once the conflict ended. The gold standard did come under pressure during the Great Depression as the dollar was devalued against gold and US private monetary gold holdings were declared illegal. Despite the erosion, the compound annual growth rate of CPI during this period was 0.54%, clearly low. The gold standard mostly favors capital owners and creditors; a key reason that political support for the gold standard began to erode in the 1920s was due to expanded suffrage. Debtors and the unpropertied that fought during WWI demanded a voice in government after the war ended. What made the gold standard work is that these classes bore the cost of austerity, but once they acquired political power, they were disinclined to accept the austerity demanded by the gold standard.
As WWII was winding down, the allies created a hybrid of the gold standard at Bretton Woods. Currencies were pegged to the dollar and the dollar was pegged to gold. As the chart above shows, it was not as effective as the gold standard in containing inflation, but it worked reasonably well. However, by the early 1970s, a precipitous drain of US gold reserves led President Nixon to suspend gold redemptions in 1971, leading to the “lost years” period on the above chart. Inflation soared.
To contain inflation and restore confidence in currencies under a fiat standard, Western central bankers gradually established two key rules: central bank independence and a clear inflation target. Over time, central banks were freed from their finance ministries, which gave them the power to conduct an independent monetary policy. Since the early 1980s, the central banks of industrialized nations have steadily been granted their independence from fiscal authorities.
The most widely adopted inflation target was 2%; this target was initially established by the Reserve Bank of New Zealand on an offhand comment to a television reporter rather than through careful study. Other central banks soon adopted the standard. Although the Federal Reserve didn’t officially adopt the standard until 2012, it was considered the de facto standard as early as 1996. As the chart above shows, the compound annual growth rate of US CPI over this period exceeded 2%. The general consensus, though, is that an inflation rate between 2% to 3% is low enough to where economic actors don’t factor inflation into consumption and investment decisions. And so, the combination of central bank independence and a clear inflation target has mostly been successful in supporting confidence in fiat currencies. International trade expanded under fiat credibility which suggests that there was general confidence in the dollar as the reserve currency and US Treasurys as the reserve asset.
On the above chart, we have added a fifth regime — The Breakup. Since the pandemic, the pace of inflation has clearly accelerated. Although central bank officials argued that the inflation issue was “transitory,” it has instead proven to be persistent. Central banks have raised interest rates but clearly not to the point where inflation has returned to the Fed’s target level.
There are two factors that we think are undermining the Fiat Credibility regime. First, there is a sentiment among some notable policymakers that the 2% target is too low. The fact that in the last decade central banks in some parts of the world lowered their policy rates below 0% and the FOMC engaged in zero interest rates plus balance sheet expansion is prima fascia evidence that the inflation target is too low. The basic idea is that a higher inflation target would give policymakers greater leeway to stimulate the economy without resorting to unorthodox monetary policy actions.
The second threat may be more formidable. Across the industrialized world, there are rising pressures on fiscal budgets. Aging populations are straining government retirement programs, and rising geopolitical tensions are leading to higher defense spending. In the US, the Congressional Budget Office is projecting high deficits for the rest of the decade.
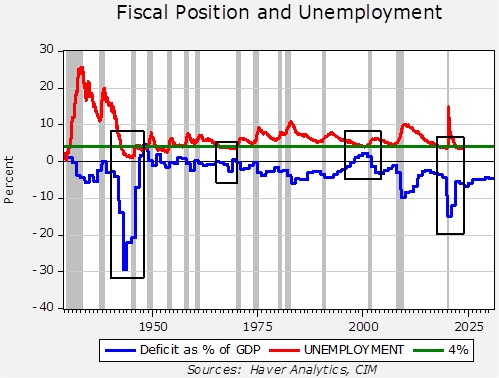
This chart shows the deficit as a percentage of GDP and the unemployment rate. We have inserted boxes around periods where the unemployment rate was at or below 4%. Note that in two periods when the unemployment was at this low level (the late 1960s and late 1990s), deficits tended to be low or, in the case of the latter event, the government ran a surplus. During the other two events (WWII and after the pandemic), the deficit widened while unemployment was low. Usually, a strong economy narrows the deficit as tax receipts rise and spending on welfare support programs declines.
What is concerning about the current situation is that despite low unemployment, the Congressional Budget Office is projecting that rather elevated deficits will be continuing. There is much criticism of this spending in the financial media, with some calling it “the largest deficit in peacetime.” We quibble with this comment, and we disagree about this being “peacetime.” In fact, if this is wartime, the deficits will likely be higher in the future. Defense spending coupled with social spending for retirees will strain budgets. In general, tax increases are politically difficult. At the same time, this cold war we are facing is already fracturing global trade, which will tend to increase structural inflation.
In the face of rising deficits, central bank independence is under threat. These deficits will need to be financed. To prevent sharp increases in interest rates, central banks may be forced to expand their balance sheets to absorb this debt in order to keep interest rates at manageable levels. Obviously, something has to give. We suspect what will “give” will be price levels. The unknown is how households and firms will react to what is essentially an increase in the inflation target. If inflation fears rise enough, economic actors will separate the medium of exchange function of money from the store of value function. If that occurs, some financial and real assets could replace the store of value function for economic actors. Our task, as asset managers, is to determine which assets will gain that function and invest accordingly.
Bi-Weekly Geopolitical Report – The Great COVID Labor Reform (May 20, 2024)
by Patrick Fearon-Hernandez, CFA | PDF
The COVID-19 pandemic of 2020 is now starting to fade from memory. Four years after the sudden outbreak of the disease sparked mass economic shutdowns, mask wearing, and millions of deaths, it’s tempting to think the crisis is becoming just another episode of history. However, the pandemic clearly led to changes in the global economy. For example, it helped usher in an era in which governments and companies worry a lot about potential supply chain disruptions.[1]
In this report, we discuss how the pandemic changed the United States labor supply. We focus on two key developments during the pandemic: 1) the mass excess retirements and deaths of baby boomers,[2] and 2) the generous income support programs implemented by the federal government. Considering these developments as a package, we show how they essentially amount to a labor market reform — perhaps the most significant US labor market reform in decades. We then examine how these labor market changes could help spur outsized US economic growth in the coming years, albeit with additional upward pressure on consumer price inflation and interest rates. We wrap up by examining the implications for investors.
[1] This would not be the first time a pandemic affected the labor markets. The “Black Death” in the 1300s killed so many workers that the lucky survivors saw a jump in real wages. After the Spanish Flu epidemic of 1918, something similar occurred.
[2] The baby boomer generation is conventionally considered to be all those born from 1946 to 1964.
There will be no accompanying podcast for this report.
Asset Allocation Bi-Weekly – #118 “The Immigration Paradox” (Posted 5/13/24)
Asset Allocation Bi-Weekly – The Immigration Paradox (May 13, 2024)
by the Asset Allocation Committee | PDF
Throughout history, immigration has been a politically charged issue, creating a rift between capital and labor. Employers have advocated for looser immigration policies to fill job vacancies, particularly for positions that don’t offer high pay. Conversely, labor unions often push for stricter policies to prevent an influx of workers that could suppress wages. This long-standing divide presents a complex challenge for policymakers seeking a middle ground that satisfies both sides.
The recent surge in immigration has reignited tensions between populists and technocrats. While populists often worry about immigration’s impact on national security, technocrats highlight its potential economic benefits. Research by the nonpartisan Congressional Budget Office estimates that immigrants could contribute $7 trillion to the economy over the next decade. At the same time, there is hope that immigration could help the Federal Reserve achieve its dual mandate of price stability and full employment. According to Fed Chair Powell, the influx of new workers has allowed the country to add new jobs without triggering significant wage pressures.
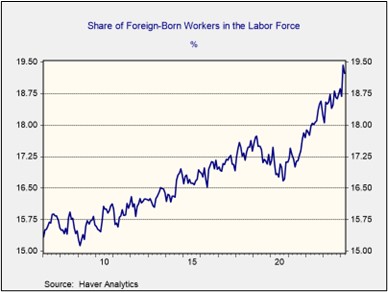
The argument for allowing increased immigration has gained momentum due to the country’s ongoing shortage of relatively low-skilled workers. Household employment data reveals there has been a decline of 1.1 million workers without a college degree since March 2020. Demographics are also unfavorable. The US fertility rate has hit a record low of 1.62, significantly below the replacement rate of 2.1 children per woman. Falling birth rates have held back the supply of US-born workers. As a result, foreign workers may have accounted for most of the job growth going back to February 2020.
Nevertheless, there is a growing push for stricter immigration policies, even as additional workers are needed for the economy. A Harris Poll survey indicates that more than half of Americans favor tighter controls on illegal immigration. Interestingly, 42% of Democrats — a demographic typically associated with looser immigration restrictions — endorse such measures. This shift in public opinion briefly spurred bipartisan support for the most restrictive immigration bill in recent history. However, the legislation ultimately crumbled as politicians pushed for even stricter measures.
Despite public opposition, rising immigration has demonstrably helped the Fed limit price inflation while keeping employment high. Over the past four years, the influx of foreign workers has helped firms keep a lid on wage rates, thereby reducing cost-push inflation. The hiring of non-natives has also expanded the labor supply without boosting the unemployment rate. For example, the recent surge of foreign workers into the labor force coincided with a fall in the non-seasonally adjusted unemployment rate, from 4.2% in February to 3.9% in March.
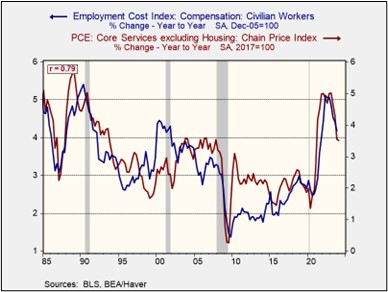
Going forward, the rising pushback against immigration may complicate the Fed’s efforts to do its job. Since one of the Fed’s preferred inflation gauges, the Core PCE index for services, is closely linked to wages, a decrease in wage growth is likely necessary in order for the Fed to achieve its inflation target in a reasonable time frame. However, strict measures to limit foreign workers could support wage growth and constrain the Fed’s ability to cut interest rates. A tighter labor market due to fewer foreign workers could put upward pressure on wages, making it harder to control inflation.
Although immigration has helped temper inflation recently, political resistance makes it an unreliable long-term solution for the Fed. Absent significant productivity gains, a more limited labor force could exacerbate inflationary pressures, which could then necessitate restrictive monetary policy to keep price pressures contained. This could lead to a period of underperformance for long-term Treasurys as investors seek higher returns to offset inflation. Of course, the labor market has historically adjusted slowly to immigration changes, so the disinflationary effects of today’s immigration will probably continue for the foreseeable future. Nevertheless, a crackdown on immigration would likely contribute to a less positive environment for bonds in the longer term.
Confluence of Ideas – #36 “Reviewing the Asset Allocation Rebalance: Q2 2024” (Posted 5/8/24)
Bi-Weekly Geopolitical Podcast – #47 “Middle East: Land of Fault Lines” (Posted 5/6/24)
Bi-Weekly Geopolitical Report – Middle East: Land of Fault Lines (May 6, 2024)
by Daniel Ortwerth, CFA | PDF
Conflict in the Middle East is one of the most persistent themes in current events. Not only is this true today, but Middle Eastern discord has dominated the news flow throughout most of our lives. At Confluence, we recognize that this enduring pattern of strife reveals the presence of many major fault lines that run through Middle Eastern society, politics, economics, and relations with the rest of the world.
A fault line is defined as a “divisive issue or difference of opinion that is likely to have serious consequences.” A major fault line is one in which the competing forces have both deeply embedded positions and the resources to support those positions. Many issues of this type characterize those in the Middle East, which explains why conflict in the region is so common despite repeated attempts at resolution. Investors must be prepared for this trend to endure for the foreseeable future, which will continue to meaningfully impact global affairs.
This report briefly reviews the main fault lines that define the Middle East from a geopolitical standpoint. This is not a complete list, but rather it is a selection of those we consider most enduring and impactful. Confluence does not take positions on these issues, but we will summarize and show how they produce complexity. We arrange these prominent fault lines in three layers: the ancient fault lines, the more modern ones, and the present-day issues that are currently causing “geopolitical earthquakes.” While these earthquakes do raise the risk of escalation into a broader regional war, we remind readers that the region has often witnessed this increased level of risk before without necessarily leading to further escalation. Rather than trying to predict the outcome, we recommend that investors pay attention to key implications, which we will highlight at the end of the report.
Don’t miss our accompanying podcasts, available on our website and most podcast platforms: Apple | Spotify
Asset Allocation Bi-Weekly – The Peace Dividend, Government Debt, and Yield Curve Control (April 29, 2024)
by the Asset Allocation Committee | PDF
Danish Prime Minister Mette Frederiksen recently castigated the European governments that slashed their defense spending at the end of the Cold War and then remained far too complacent about the growing threat from Russia in recent years. According to Frederiksen, hiking their defense budgets as is now necessary will require countries to reverse the tax cuts and welfare spending hikes they have been funding with their post-Cold War defense reductions. The United States may be in the same position since it also spent its post-Cold War “peace dividend” on civilian programs. This report looks at these fiscal dynamics and what future fiscal and monetary policy might really look like.
As our regular readers know, we at Confluence believe the intensifying rivalry between the US geopolitical bloc and the China/Russia bloc will lead to bigger future defense budgets in many countries. Western nations that cut their defense spending dramatically after the Cold War and spent the resulting peace dividend on civilian programs will soon be under great pressure to reverse course. We have also argued that growing geopolitical tensions will likely lead to stronger government intervention in Western economies. Frederiksen is one of the first Western leaders to state the trade-offs so clearly: Hiking defense budgets as required now may well require tax hikes and/or civilian spending cuts.
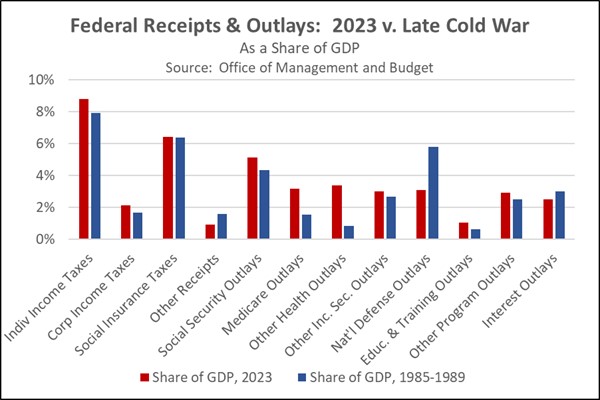
To scope out the prospects, we compared today’s US federal budget to the budgets of the late years of the Cold War. In the chart below, we show the Office of Management and Budget’s estimated fiscal year 2023 federal receipts and outlays as a share of gross domestic product and compare them to their average shares from 1985 to 1989. The chart shows the US has cut its defense spending by about 2.7% of GDP since the late Cold War. However, it also boosted its outlays on Medicare, Medicaid, other healthcare, and Social Security retirement benefits by a total of 5.1% of GDP. (In large part, those spending hikes probably reflect the aging of the US population and rampant healthcare price inflation.) The excess of new spending over the peace dividend is mostly explained by a small rise in tax receipts and a major expansion in the budget deficit.
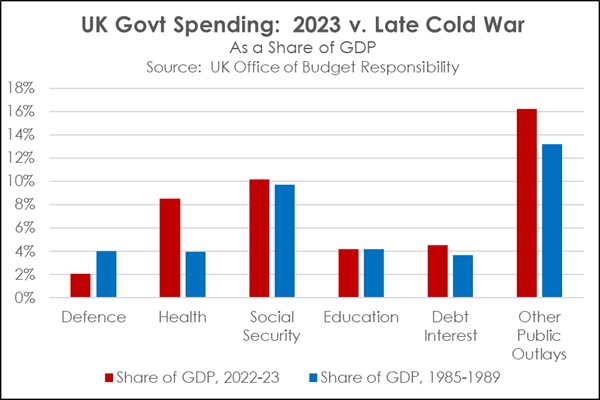
Comparable data for European countries is hard to come by, likely because of relatively bigger economic, financial, and political changes after the Cold War. Nevertheless, a review of government outlays in the United Kingdom suggests European countries spent their peace dividend in roughly the same way that the US did. As shown in the chart below, the UK cut its defense spending by 1.9% of GDP and then hiked healthcare, social security, and other civilian spending by a total of about 8.1% of GDP. It would not be a surprise if other Western nations shifted their budget spending in similar ways.
This reorientation of the West’s public spending will have enormous political and financial implications in the coming years. Of course, much of the increased social security and healthcare spending has benefited politically powerful senior citizens. We think those seniors would thwart any substantial cuts to that spending to fund higher defense budgets. For example, if US leaders now wanted to boost the defense budget back to the late-Cold War average of 5.8% of GDP from today’s 3.1% of GDP, not much of the required $708 billion in new military spending would likely come from cuts to Social Security, Medicare, and Medicaid outlays. Other civilian outlays today are not much higher (as a share of GDP) than they were in President Reagan’s second term. Therefore, even if those programs were cut to their share of GDP in 1985-1989, the savings would cover less than half of the targeted boost in defense spending. The shortfall could theoretically be made up with new revenues, but we think today’s strong political opposition to taxes means the required tax hike of about $400 billion would be a nonstarter in Congress.
If political realities mean defense rebuilding can’t be fully funded by cutting civilian spending or hiking taxes, what will Western governments do? We think the likely answer would be even bigger budget deficits coupled with financial repression. In other words, Western governments would likely fund higher defense spending largely by borrowing. To limit the resulting interest costs, agencies such as the US Treasury and central banks such as the Federal Reserve would probably adopt policies to keep bond yields artificially low, such as by forcing banks to buy and hold more Treasury bonds. The central banks could also adopt yield curve control, in which a central bank, such as the Fed, caps long-term yields by buying up Treasurys. While this may seem implausible to many investors, it’s important to remember that there is a precedent for this policy. Indeed, financial repression was used in the decades right after World War II to help the US government weather the debt overhang left after the war ended. The implication for bond investors is that the yields on their future government bonds may not keep up with consumer price inflation, and their purchasing power may slowly erode over time.
Note: there will not be an accompanying podcast for this report.