by the Asset Allocation Committee | PDF
Danish Prime Minister Mette Frederiksen recently castigated the European governments that slashed their defense spending at the end of the Cold War and then remained far too complacent about the growing threat from Russia in recent years. According to Frederiksen, hiking their defense budgets as is now necessary will require countries to reverse the tax cuts and welfare spending hikes they have been funding with their post-Cold War defense reductions. The United States may be in the same position since it also spent its post-Cold War “peace dividend” on civilian programs. This report looks at these fiscal dynamics and what future fiscal and monetary policy might really look like.
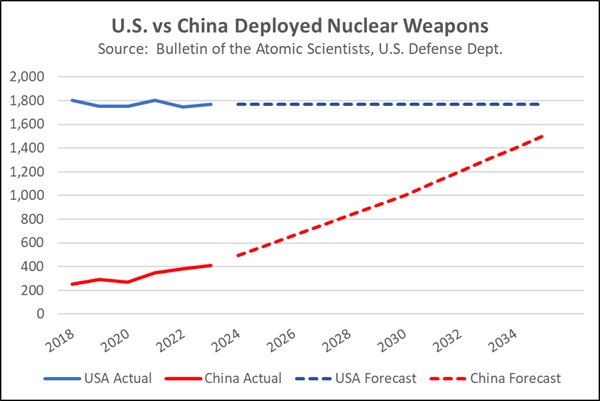
As our regular readers know, we at Confluence believe the intensifying rivalry between the US geopolitical bloc and the China/Russia bloc will lead to bigger future defense budgets in many countries. Western nations that cut their defense spending dramatically after the Cold War and spent the resulting peace dividend on civilian programs will soon be under great pressure to reverse course. We have also argued that growing geopolitical tensions will likely lead to stronger government intervention in Western economies. Frederiksen is one of the first Western leaders to state the trade-offs so clearly: Hiking defense budgets as required now may well require tax hikes and/or civilian spending cuts.
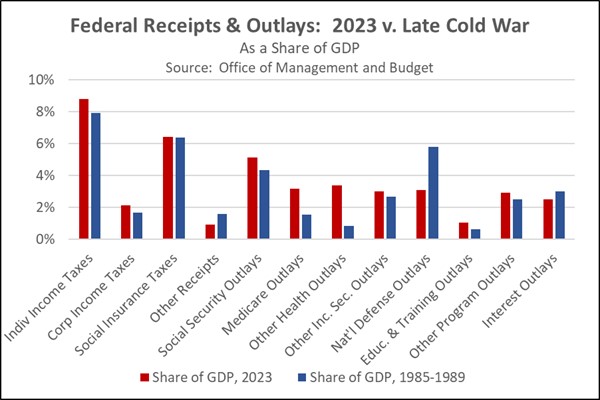
To scope out the prospects, we compared today’s US federal budget to the budgets of the late years of the Cold War. In the chart below, we show the Office of Management and Budget’s estimated fiscal year 2023 federal receipts and outlays as a share of gross domestic product and compare them to their average shares from 1985 to 1989. The chart shows the US has cut its defense spending by about 2.7% of GDP since the late Cold War. However, it also boosted its outlays on Medicare, Medicaid, other healthcare, and Social Security retirement benefits by a total of 5.1% of GDP. (In large part, those spending hikes probably reflect the aging of the US population and rampant healthcare price inflation.) The excess of new spending over the peace dividend is mostly explained by a small rise in tax receipts and a major expansion in the budget deficit.
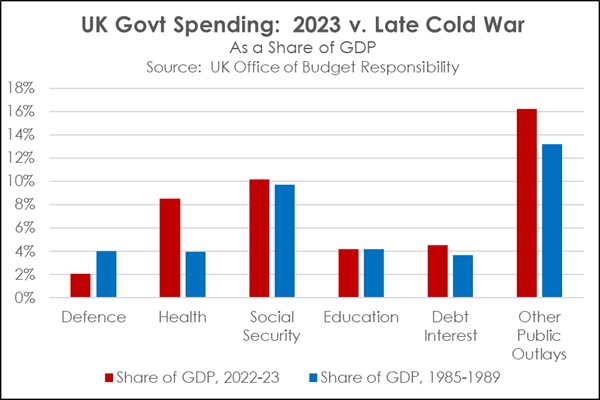
Comparable data for European countries is hard to come by, likely because of relatively bigger economic, financial, and political changes after the Cold War. Nevertheless, a review of government outlays in the United Kingdom suggests European countries spent their peace dividend in roughly the same way that the US did. As shown in the chart below, the UK cut its defense spending by 1.9% of GDP and then hiked healthcare, social security, and other civilian spending by a total of about 8.1% of GDP. It would not be a surprise if other Western nations shifted their budget spending in similar ways.
This reorientation of the West’s public spending will have enormous political and financial implications in the coming years. Of course, much of the increased social security and healthcare spending has benefited politically powerful senior citizens. We think those seniors would thwart any substantial cuts to that spending to fund higher defense budgets. For example, if US leaders now wanted to boost the defense budget back to the late-Cold War average of 5.8% of GDP from today’s 3.1% of GDP, not much of the required $708 billion in new military spending would likely come from cuts to Social Security, Medicare, and Medicaid outlays. Other civilian outlays today are not much higher (as a share of GDP) than they were in President Reagan’s second term. Therefore, even if those programs were cut to their share of GDP in 1985-1989, the savings would cover less than half of the targeted boost in defense spending. The shortfall could theoretically be made up with new revenues, but we think today’s strong political opposition to taxes means the required tax hike of about $400 billion would be a nonstarter in Congress.
If political realities mean defense rebuilding can’t be fully funded by cutting civilian spending or hiking taxes, what will Western governments do? We think the likely answer would be even bigger budget deficits coupled with financial repression. In other words, Western governments would likely fund higher defense spending largely by borrowing. To limit the resulting interest costs, agencies such as the US Treasury and central banks such as the Federal Reserve would probably adopt policies to keep bond yields artificially low, such as by forcing banks to buy and hold more Treasury bonds. The central banks could also adopt yield curve control, in which a central bank, such as the Fed, caps long-term yields by buying up Treasurys. While this may seem implausible to many investors, it’s important to remember that there is a precedent for this policy. Indeed, financial repression was used in the decades right after World War II to help the US government weather the debt overhang left after the war ended. The implication for bond investors is that the yields on their future government bonds may not keep up with consumer price inflation, and their purchasing power may slowly erode over time.
Note: there will not be an accompanying podcast for this report.