by the Asset Allocation Committee | PDF
In an important adjustment to our Asset Allocation strategies last October, we introduced an exchange-traded fund focused on uranium producers into our mid-cap equity exposure. At the time, we noted in our Asset Allocation Quarterly that the move aimed to take advantage of government policies around the world that are encouraging an increase in the use of nuclear power to generate electricity, even as uranium supply is crimped. However, we have not yet provided the in-depth explanation of our view that we usually do. This report aims to start addressing that by giving a broad outlook for uranium demand and supply in the coming decades. We expect to provide additional analysis of the uranium market in other reports in the coming weeks and months.
The chart below, from the World Nuclear Association, shows expected global demand and supply for the uranium used in electricity generation — by far the main source of demand for uranium. As shown in the chart, electricity-generating demand for uranium is expected to rise from 65,651 metric tons in 2023 to about 110,000 metric tons by 2040, for a compound annual growth rate of 3.1%. The expected rise in demand largely reflects new reactors currently under construction, planned, or proposed (net of reactor retirements). China accounts for only 55 of the world’s current fleet of 436 operating reactors and 17% of today’s total global uranium demand, but its expected build-out of more than 220 new plants by 2040 represents about 44% of the new reactors to be added during the period and at least that share of the additional global uranium demand. India is in a distant second place in terms of expected new reactors and uranium demand. New and improved generating technologies could also support expanded generating demand.
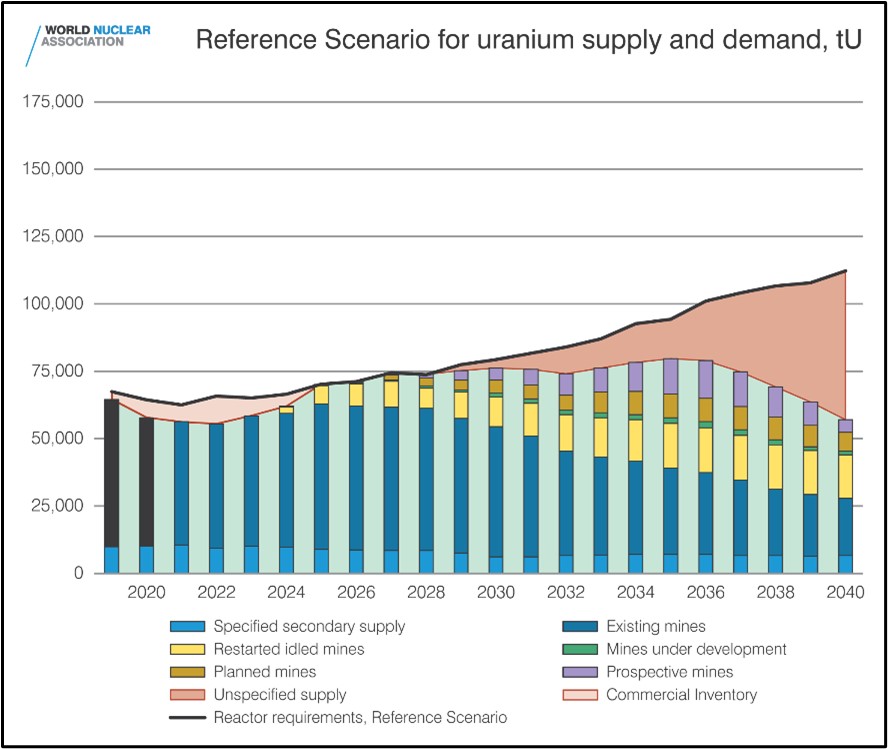
As shown in the chart above, most of the current and future generating uranium is expected to come from existing mines, followed by restarted mines, mines under development, planned mines, and prospective mines. Note that total mined uranium and secondary supplies are expected to fall far short of demand in the coming decades. Many economists and industry authorities therefore expect a sharp rise in uranium prices, which would incentivize the opening of new mines. Indeed, spot uranium prices have already surged some 66% just from our entry point into the ETF on October 19 through February. Since electric utilities need to secure long-term fuel supplies, most uranium is currently sold under long-term contracts, so the producers in our ETF haven’t necessarily gotten the full benefit of today’s spot prices. However, since the looming rise in demand is expected to make uranium increasingly valuable, we believe producers will soon see new opportunities to expand production at profitable prices.
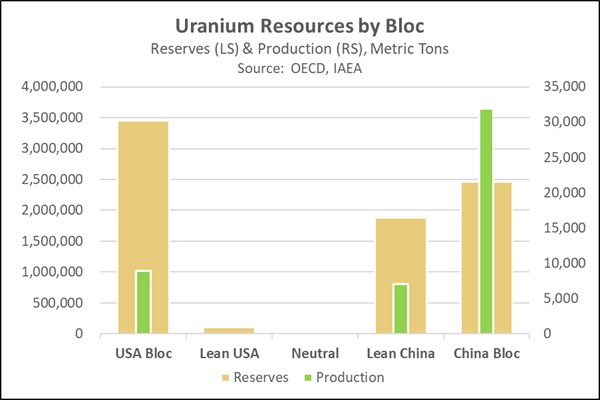
As our regular readers know, we at Confluence believe a key trend going forward is that the world will keep fracturing into relatively separate geopolitical and economic blocs, and that the China/Russia bloc is likely to crimp supplies to the US bloc as tensions mount. Fortunately, as shown in the chart below, uranium deposits are well distributed — even common — around the world. Still, most of the world’s production today comes from the China/Russia bloc, with Kazakhstan being the main producer (at 46% of the total), followed by Uzbekistan and Russia.
Why does Kazakhstan account for such a preponderant share of today’s global uranium output? To understand that, it’s important to first review recent global price trends. From the run-up to the Global Financial Crisis of 2008-2009 until 2016, global spot uranium prices fell by more than 50% in the face of increased supply from dismantled nuclear weapons and falling demand due to newfound generating efficiencies and safety concerns after the Fukushima accident in Japan. Low prices made it unprofitable to mine much uranium in regions where the cost of production was high. As shown in the chart below, the China/Russia bloc, and Kazakhstan in particular, has a near monopoly on the world’s supply of ultra-low-cost uranium. Kazakhstan’s production cost currently averages less than $40/kg. That’s equivalent to about $18.18/lb and well below the average market price of about $50.00/lb through much of 2023 and the current price of almost $100.00/lb.
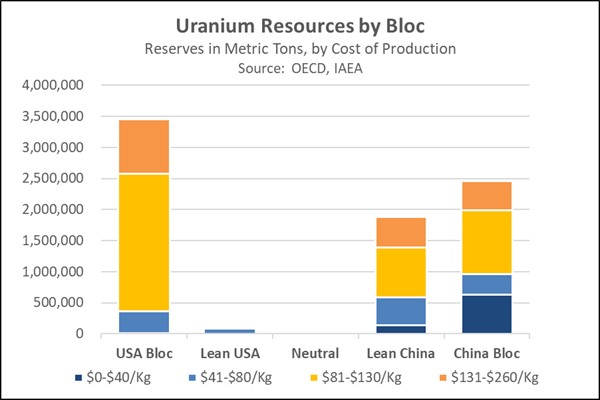
As shown in the last chart, most of the uranium available in the US bloc (largely consisting of deposits in Australia and Canada) costs $80 to $260 per kg to produce. That’s equivalent to about $36.36 to $118.18 per pound, rendering it uneconomical to produce until recently. Going forward, we believe that the expected increase in global demand, the growing shortfall in total mine production, and the risk of supply restrictions out of the China/Russia bloc will boost uranium prices further and lead to new, profitable production opportunities for uranium producers even in higher-cost regions of the world. We therefore believe our new exposure to uranium producers could provide additional risk-adjusted returns within Confluence’s asset-allocation portfolios.