

Author: Amanda Ahne
Asset Allocation Bi-Weekly – U.S. Oil Production at a Record High (February 5, 2024)
by the Asset Allocation Committee | PDF
These days, because investors have so many different assets to buy in so many different financial markets, it can be easy to miss an important trend or change in trend. Indeed, that seems to be the case with crude oil, where the long stagnation in U.S. output after the COVID-19 pandemic has suddenly turned into a new surge. In fact, U.S. oil production has recently reached a new record high. In this report, we explore what allowed domestic output to start expanding again, what it means for the global economy, and the potential implications for investors.
As shown in the chart below, U.S. field production has fluctuated quite a bit over the last century. From 1920 to 1970, output grew approximately 4.2% per year, reaching 9.6 million barrels per day (bpd). However, output then fell and plateaued, despite the incentives to produce during the period’s high prices. Beginning in about 1985, production began what appeared to be an inexorable decline in the face of public policy and the limits of the available technology. To many people’s surprise, output suddenly reversed and started growing rapidly again during the Great Financial Crisis of 2008-2009, driven by new technologies such as hydraulic fracturing and horizontal drilling that opened up previously untappable shale formations. U.S. production jumped at an annual rate of 8.7% from 2009 to 2019, reaching almost 13.0 million bpd.
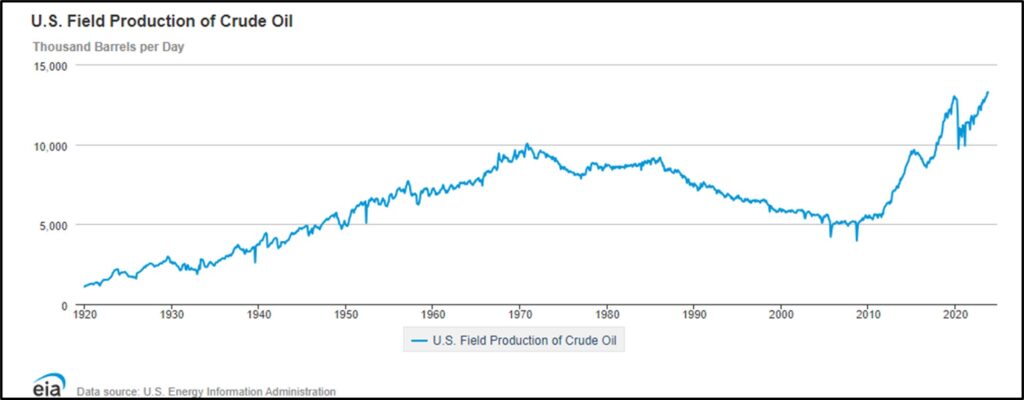
Obviously, the pandemic was a shock to the global economy. With the collapse in demand, oil prices actually turned negative for a short time in early 2020. More importantly, U.S. output fell sharply and appeared to stagnate. Much of the stagnation reflected reduced investment in new exploration and development as investors demanded better capital discipline and a stronger focus on profitability after the many bankruptcies of shale drillers during the period of 2009-2019. Stronger environmental regulations, which aimed to shift the economy away from fossil fuels, also discouraged drilling. Many investors began to question whether the industry could ever grow again.
In mid-2023, U.S. oil output began to accelerate in earnest, likely reflecting the incentive of high energy prices at the time and an unexpected second wind from technology improvements. Press reports say fracking and other shale technologies as well as operating approaches have simply improved more than expected. In any case, U.S. oil output has now reached 13.3 million bpd.
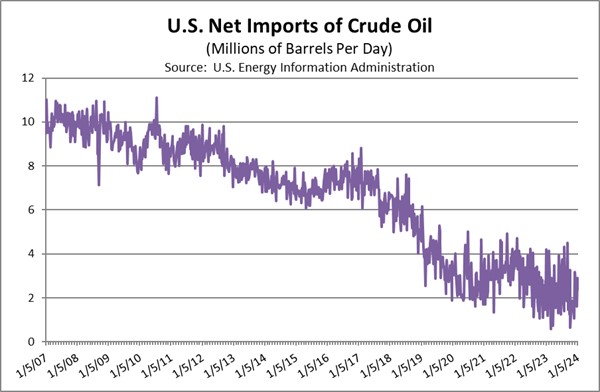
For the global economy, booming U.S. oil output doesn’t just mean that the country has become the world’s largest producer (which it has). As shown in the chart below, it also means that the U.S. has been able to significantly scale back its imports of foreign oil.
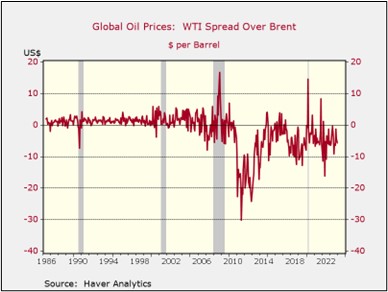
Surging U.S. oil production has altered global pricing dynamics. For example, before the shale boom, U.S. domestic oil prices (represented by the West Texas Intermediate) were typically slightly higher than foreign prices (represented by Brent Crude). For the last decade, however, the rich supply of domestic oil has held down U.S. prices. Reduced U.S. import demand and new laws allowing U.S. oil exports have also improved supplies for other countries. As shown in the following chart, Brent Crude now tends to trade several dollars higher than WTI. Nevertheless, the U.S. changes haven’t been enough to totally offset the fact that Saudi Arabia and its partners in OPEC and OPEC+ are withholding supplies in order to boost prices.
Going forward, the unexpected rebound of U.S. oil output and exports signifies that American production could help keep a lid on global prices for an extended period, even as the OPEC+ countries continue to withhold barrels. What could change the outlook? One key risk that we’re focused on is the possibility of a geopolitical crisis that disrupts supplies from a major foreign producer or exporter. If such a crisis occurs outside the Middle East, the availability of excess output capacity in Saudi Arabia and the rest of OPEC+ could potentially fill in the gap. If the crisis disrupts Middle Eastern supplies, however, the result would likely be a spike in global prices despite the renewed U.S. output boom and excess production capacity in the region.
Bi-Weekly Geopolitical Podcast – #40 “Introducing the U.S. Space Force” (Posted 1/29/24)
Bi-Weekly Geopolitical Report – Introducing the U.S. Space Force (January 29, 2024)
by Daniel Ortwerth, CFA | PDF
On December 20, 2019, something extremely rare happened in the United States Armed Forces: An entirely new branch of service was born. For context, the Army, Navy, and Marine Corps were born by acts of the Continental Congress in 1775. The Coast Guard came into being by act of the first U.S. Congress in 1790, and the relatively young Air Force was born by a similar act of Congress in 1947. Clearly, these are very rare events, so it was a historic occasion when Congress authorized the establishment of the U.S. Space Force (USSF) as an independent branch of the U.S. Military just four years ago.
We begin this report by discussing the background of the USSF, including how its birth was similar to that of the U.S. Air Force (USAF) and how its relationship with the USAF is similar to the Marine Corps’ relationship with the Navy. We also discuss why a new service branch was deemed necessary and what it says about the future of space warfare. As always, we wrap up with a discussion of the implications for investors.
Don’t miss our accompanying podcasts, available on our website and most podcast platforms: Apple | Spotify | Google
Business Cycle Report (January 25, 2024)
by Thomas Wash | PDF
The business cycle has a major impact on financial markets; recessions usually accompany bear markets in equities. The intention of this report is to keep our readers apprised of the potential for recession, updated on a monthly basis. Although it isn’t the final word on our views about recession, it is part of our process in signaling the potential for a downturn.
The Confluence Diffusion Index increased from the previous month, suggesting that economic conditions are improving. The December report showed that six out of 11 benchmarks are in contraction territory. Last month, the diffusion index increased from -0.2727 to -0.1515, slightly below the recovery signal of -0.1000.
- Long duration assets received a boost from dovish Fed talk.
- Manufacturing production was weak, but demand for goods has ticked up.
- Jobs data reinforces views that the labor market is resilient.
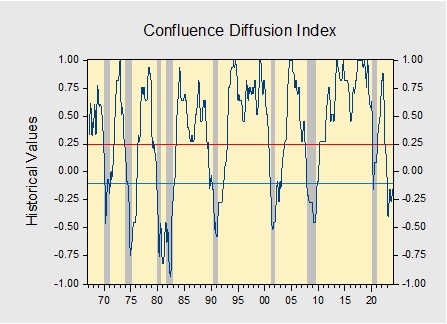
The chart above shows the Confluence Diffusion Index. It uses a three-month moving average of 11 leading indicators to track the state of the business cycle. The red line signals when the business cycle is headed toward a contraction, while the blue line signals when the business cycle is in recovery. The diffusion index currently provides about six months of lead time for a contraction and five months of lead time for recovery. Continue reading for an in-depth understanding of how the indicators are performing. At the end of the report, the Glossary of Charts describes each chart and its measures. In addition, a chart title listed in red indicates that the index is signaling recession.
Keller Quarterly (January 2024)
Letter to Investors | PDF
About 125 years ago, a reporter spied J.P. Morgan on the streets of New York and ran over to get a prediction and a quote. “What will the stock market do?” the reporter asked the great banker and investor. “It will fluctuate,” was Morgan’s droll reply. The reporter dutifully reported the quotation but was disappointed in its generality. He was hoping to get a scoop! He anticipated getting a prediction from the man who knew the stock market better than almost anyone.
J.P. Morgan’s response has been ridiculed over the years, said to be both true and useless. I disagree. The great man did speak the truth, but he also gave us a most useful observation. The reporter was on a fool’s errand to think that this expert on the stock market could predict the future simply because he was learned. In this folly the reporter has had many followers. Many business reporters in print and television continue to press “experts” for predictions of the future. Morgan was not going to take the bait. He knew that the best thing an investor could do was to recognize that the stock market would fluctuate…and leave it at that.
Then why invest in stocks if all they’re going to do is fluctuate? You invest because you believe that over time the U.S. economy and the great companies within it will grow. Time is the investor’s friend. But investment is not what J.P. Morgan’s reporter and most daily viewers of CNBC are interested in. They want to know what the stock market is going to do tomorrow so they can speculate in stocks. Speculation requires a guess as to what a stock or an index will do in the very near future. Investment requires a calculation of the likely returns a company’s shareholders will receive over time. Speculators worry about stocks fluctuating because they may fluctuate in the wrong direction. Investors don’t worry about short-term fluctuations in prices. In fact, if the fluctuations are large enough, investors may use them as opportunities to either buy or sell.
This was illustrated by Benjamin Graham, the father of our profession, in his wonderful book, The Intelligent Investor. He tells us to imagine that we own an interest in a business, and that we have a partner in that business who is a benign, but insane, man named Mr. Market. Every day, Mr. Market decides to offer a price at which he is willing to buy your stake in the business or, in the alternative, sell you some more. The price he offers changes daily, depending on his mood. Some days he’s feeling greatly optimistic. Some days he is fearful that all will be lost. Thus, the price will bounce all over the place, often in the absence of any information that anything has changed.
Most of the time you can ignore Mr. Market. But a careful study of the business you own with him should lead you to conclude that, occasionally, when his offer price is absurdly high or low, you should take advantage of his offer. Graham concluded that most of the time an investor “will do better if he forgets about the stock market and pays attention to the dividend returns and to the operating results of his companies.”
We have often seen the entire stock market behave like Mr. Market, even in recent months. On July 31 of last year, the S&P 500 (one of the broadest indexes of the U.S. stock market) closed at 4589. About three months later, on October 27, it closed at 4117, about 10.3% less, on virtually no change in the economy or business fundamentals. During that time frame, there was no change in the FOMC’s fed funds rate. All that had changed was Mr. Market’s increasing worry that the Fed might raise rates some more and hurt the economy. After October 27, Mr. Market’s worrying began to abate, and he began to be optimistic that the Fed might actually start to cut its fed funds rate. Thus, over the next 2 ½ months to January 17, the S&P 500 rose 15.1% to a close of 4739. Did much of anything change? No. The fed funds rate is the same as it was on July 31 of last year. All that changed was Mr. Market’s mood.
We have sought to build an investment process that is founded on Benjamin Graham’s analysis of J.P. Morgan’s observation: stock prices will fluctuate, but often not for any good reason other than the emotions of the moment. What we constantly remind ourselves is that we are buying and selling businesses, and that the value of those businesses rarely varies as much as Mr. Market’s daily offer price. We seek to buy and hold outstanding businesses, based on our definition of what makes for an outstanding business. Once we identify such a business, we then look for Mr. Market to offer it to us at an attractive price. If we are patient, he usually does just that.
Fundamental to this process is a belief that the price of a stock and its value are not the same thing. Oscar Wilde once famously said that “a cynic is someone who knows the price of everything, and the value of nothing.” I might say the same about many so-called investors. Knowing the price is easy: Mr. Market sets it for you every day. Knowing the value is the hard part: it is only discerned through a process of disciplined analysis. But, in our opinion, this is the only way to use Mr. Market’s unpredictability to one’s advantage.
Happy New Year to you and yours.
We appreciate your confidence in us.
Gratefully,
Mark A. Keller, CFA
CEO and Chief Investment Officer
Asset Allocation Bi-Weekly – #112 “How Does Powell Define Restrictive Monetary Policy?” (Posted 1/22/24)
Asset Allocation Bi-Weekly – How Does Powell Define Restrictive Monetary Policy? (January 22, 2024)
by the Asset Allocation Committee | PDF
Traditionally, the term “restrictive monetary policy” has been associated with a fed funds interest rate that is high enough to slow economic activity, but recent remarks from Federal Reserve Chair Powell suggest there may be a broader interpretation. Despite casting doubts on rate cuts just two weeks prior, Powell surprised the markets following the December 12-13 policy meeting of the Federal Open Market Committee (FOMC) by characterizing the current policy stance as “well into restrictive territory.” This marked a significant departure from his statement just weeks earlier that the central bank was still seeking a “sufficiently restrictive stance.”
Powell’s sudden change of heart may have been related to volatility in the repo market. On December 1, the Secured Overnight Financing Rate (SOFR), a reference rate for transactions of overnight repurchase agreements, skyrocketed to a record high 5.39% before dropping 8 bps over the next 10 days. A similar event took place nearly two weeks after the FOMC’s mid-December rate decision, as SOFR reached another record high of 5.40% before dropping back to 5.31% over the following days.
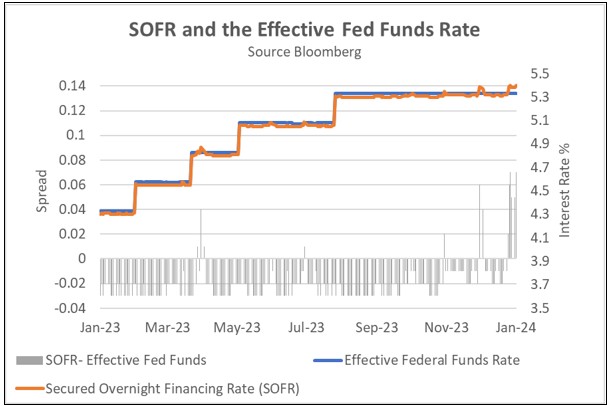
In a stark sign of growing liquidity strains in the financial system, the most recent surge in SOFR pushed its spread over the effective fed funds rate to the widest level since 2020. Because SOFR requires collateral, unlike the unsecured fed funds rate, this spread indicates that banks might be having difficulty finding cheap overnight funding through traditional channels and are seeking the more favorable terms offered by the Fed’s backstop facilities. In December, banks pulled $203 million from the Standing Repo Facility, while borrowings from the Bank Term Funding Program rose to an all-time high of $136 billion.
Beyond the usual end-of-quarter, window-dressing balance sheet adjustments made by many financial institutions, the spike in SOFR is likely caused by underlying issues in the financial system itself. As 2023 was heading for a close, there were signs that the financial system may not be able to absorb the amount of government debt being issued to fund the deficit. In October, Treasury auctions saw weakening demand as investors began demanding higher term premiums to take on more debt. Subsequently, policymakers signaled that they would pause rate hikes indefinitely, hinting at their intent to avoid further dampening of future auction demand.
Recent instability in the repo market raises questions about the Fed’s next move. Following the collapse of Silicon Valley Bank in March, a similar jump in the SOFR/fed funds spread prompted the creation of emergency lending facilities to protect against deposit flight. These targeted programs helped avert a financial crisis by allowing banks to pledge discounted U.S. Treasury and agency debt as collateral at face value in exchange for ultra-cheap loans significantly below the benchmark rate. While this swift action successfully averted a wider financial meltdown, it enlarged the central bank’s balance sheet, making it harder to return to normalcy. Therefore, the Fed has signaled that these facilities will close on March 11 as previously planned.
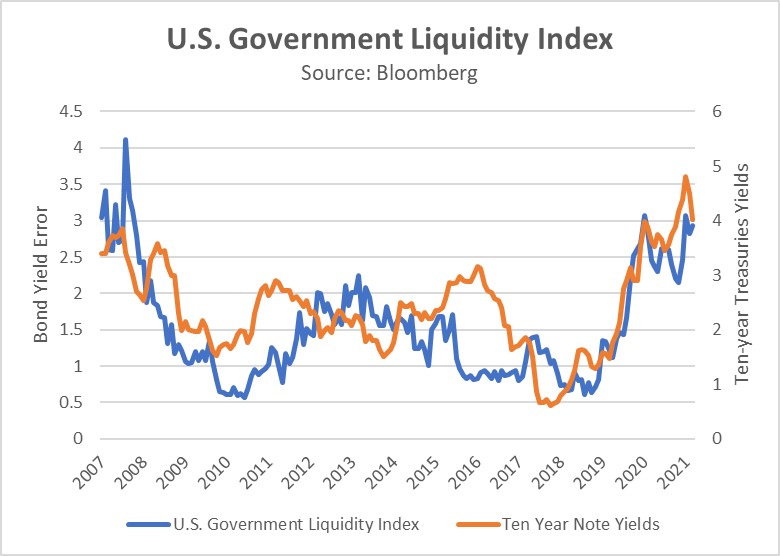
While quantitative easing has been suggested, there are other options that could be more effective and less disruptive to the Fed’s goal of policy normalization. As the chart above shows, the Bloomberg U.S. Government Securities Liquidity Index[1], which tracks the yield error of government bonds with maturities of one year or more, has risen in tandem with 10-year Treasury yields to its highest level since 2007. If rising rates is what led to a decrease in government bond liquidity, a decline in rates should have the opposite effect. This potential policy shift might explain some of the current market movements.
In short, although price stability and full employment are core goals of the Federal Reserve, financial stability must be considered an equally crucial objective. This may explain why Jerome Powell’s recent use of the term “restrictive” could hint at a policy rate high enough to cause turbulence in the repo market. While a policy pivot might seem contradictory to the central bank’s fight against inflation, robust financial markets are fundamental to a healthy economy. Fortunately, market forces, fueled by expectations of easing by the Fed, have significantly lowered long-term yields, easing pressure for aggressive stimulus. However, ongoing concerns about the repo market due to Treasury saturation could still leave the door open for increased monetary easing efforts.
[1] US Government Securities Liquidity Index: The index GVLQUSD is a measure of prevailing liquidity conditions in the U.S. Treasury market. This index displays the average yield error across the universe of U.S. Treasury notes and bonds with remaining maturity one-year or greater, based off the intra-day Bloomberg relative value curve fitter. When liquidity conditions are favorable, the average yield errors are small as any dislocations from fair value are normalized within a short timeframe. Under stressed liquidity conditions, dislocations from fair value implied by the curve fitter can remain persistent resulting in large average yield errors. CBBT is the pricing source for all Treasury notes and bonds used in this index calculation.