by the Asset Allocation Committee | PDF
(Note: This is the final AABW of 2023; the next report will be published in January 2024.)
In 1929, Coca-Cola® introduced the tagline “a pause that refreshes.” Although other advertising campaigns have come and gone, this line still sticks around in the public consciousness. And, it has moved beyond a cold soft drink on a hot day as it can also refer to monetary policy.
First, is the FOMC in or near a pause? Let’s take a look.
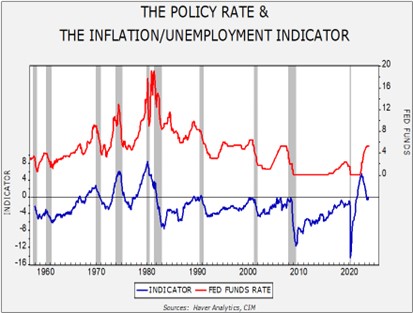
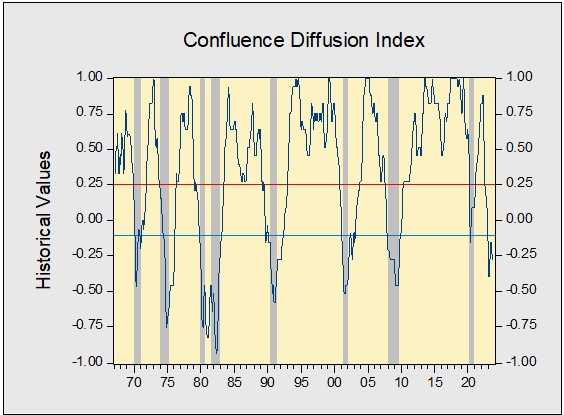
The FOMC, for the most part, still relies on the Phillip’s Curve—the idea that there is a tradeoff between unemployment and inflation. Although it is doubtful that this relationship is strong enough to use as a basis for policy, the lack of an alternative means the Fed has continued to use this model. And so, on the lower line in the chart above, we simply take the yearly change in CPI less the unemployment rate. As the chart shows, prior to 1980, the Fed tended to react to CPI exceeding the unemployment rate (a positive reading in the indicator) by raising the policy rate. However, as soon as the indictor began to fall, the policy rate was lowered. The unabated rise in inflation led the Fed to move to a pre-emptive stance. After 1980, the FOMC would begin to raise rates if the indicator merely approached zero, and it would keep rates elevated until the indicator showed clear signs of falling. That was true until 2021. The Powell Fed allowed the indicator to move strongly positive and then reacted aggressively to correct its error.
Now we have an indicator that is -0.7. Although this level wouldn’t preclude additional rate increases, if the current downward trend in the indicator continues, then the FOMC will likely at least stop raising rates. Inflation has been falling, and we note that unemployment has been increasing as well. In fact, we are rapidly closing in on a key recession signal.
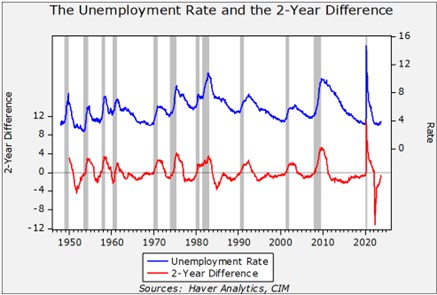
In general, when the current unemployment rate exceeds the rate from two years prior, the economy is typically in recession. If the current unemployment rate continues to hold steady into year’s end, then the difference will be zero.
For the equity market, pauses that are not associated with an immediate recession are bullish.
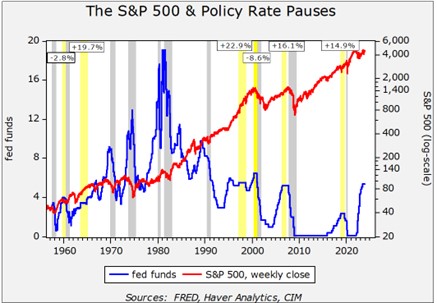
The above chart shows the weekly close for the S&P 500 and the policy rate. We have highlighted policy rate pauses in yellow that lasted at least six months going back to the late 1950s. The index change data is shown in boxes and refers to the change in the S&P 500 over the period of the pause. The data shows that long pauses raise hopes of a soft landing, which is a policy tightening cycle that doesn’t result in an immediate recession. The pauses that led to an immediate recession showed a decline in the S&P 500 Index prior to the onset of recession. However, the pauses that either avoided a downturn or experienced downturns that weren’t immediate, tended to have strong returns over the period of the pause.
This chart illustrates the dilemma for equity investors as we head into 2024. If the Fed is about to embark on a period of steady policy rates, and the recession is delayed or avoided, history would support a rise of 15% to 25% in the overall equity markets in the coming months. On the other hand, if a recession comes, then a decline is likely.
Perhaps the most difficult question is the length of the pause. In the above graph, it’s notable that extended policy rate pauses tended to disappear from the mid-1960s into the mid-1990s, which likely reflects a higher inflation environment. Simply put, there was increased volatility in the policy rate, likely due to the higher and more volatile inflation environment. So, if the FOMC is going to implement a lengthy pause, further declines in inflation will probably be necessary. But, if the recent inflation spike was an artifact of the pandemic, and isn’t structural, a long pause could develop which would be bullish for equities. Of course, that outcome would depend on the avoidance of a recession, and it’s unclear whether the recent policy tightening will lead to a downturn.
View PDF


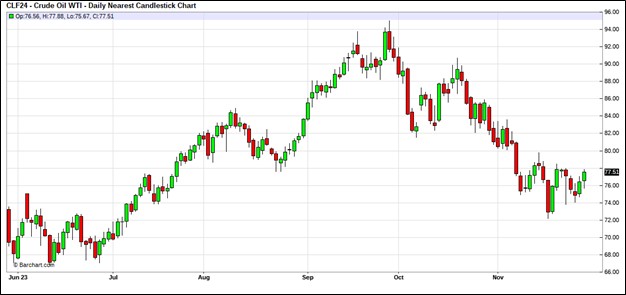
 (Source: Barchart.com)
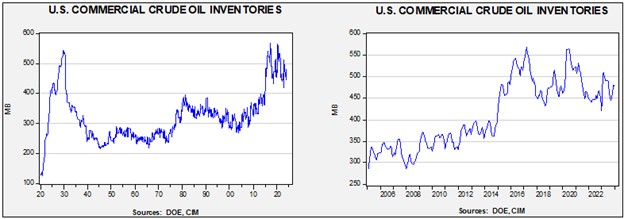
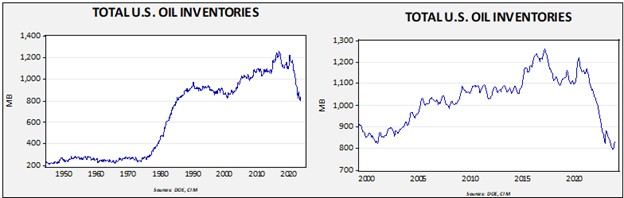
 (Sources: DOE, CIM)
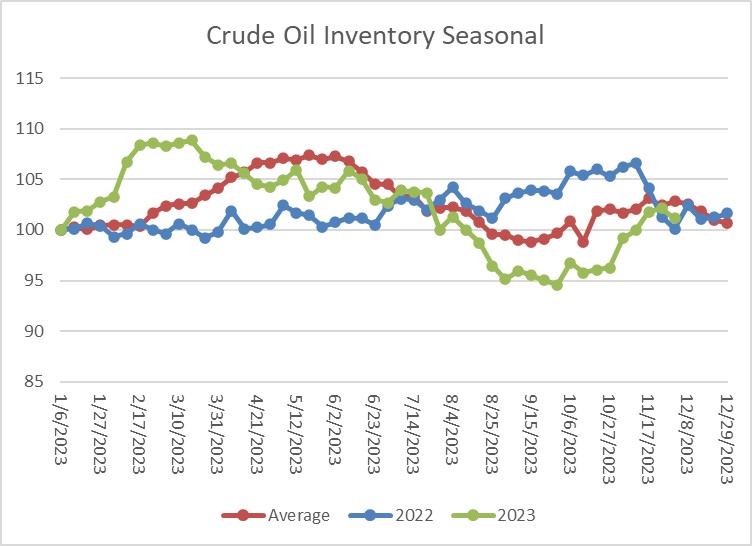
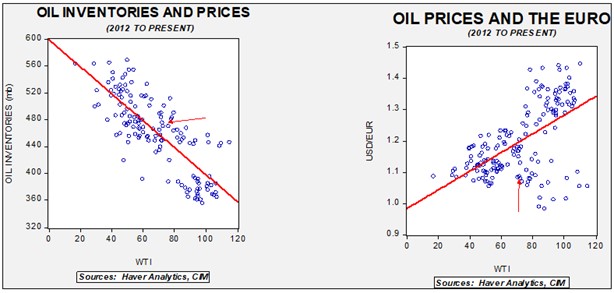
 (Source: Barchart.com)
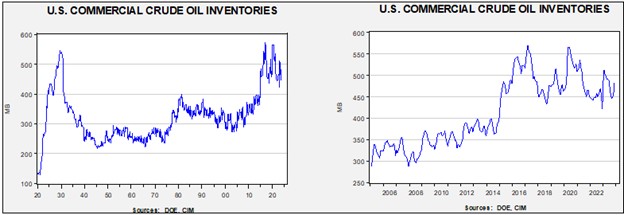
 (Sources: DOE, CIM)
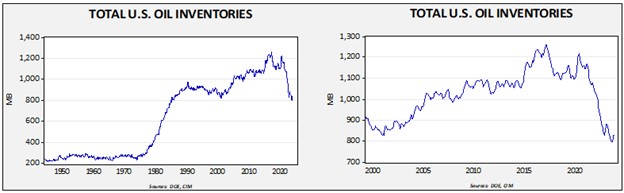
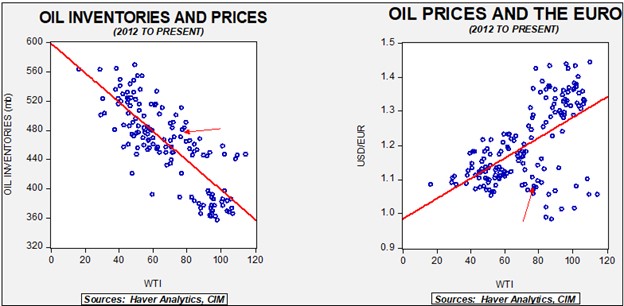
 (Source: Washington Post)