

Author: Amanda Ahne
Asset Allocation Bi-Weekly – The FOMC in 2024 (October 9, 2023)
by the Asset Allocation Committee | PDF
The Federal Reserve’s Federal Open Market Committee (FOMC) votes on monetary policy. The FOMC consists of seven governors, the New York FRB president, and a rotating roster of four regional presidents who serve a one-year term on the committee. This rotation feature means that the policy leanings of the FOMC could change each year. In our observations, though, the changes from year to year are not typically monumental, but at the margin, the composition of the committee might trigger more rapid policy shifts or changes in the number of dissents to policy decisions.
This table shows the breakdown of the FOMC:
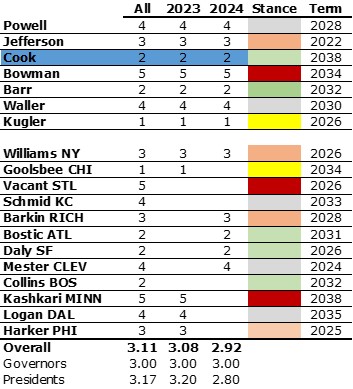
(Sources: Federal Reserve, Bloomberg, Confluence)
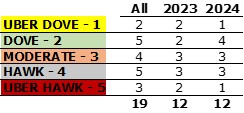
Using Bloomberg’s assessment of policy leanings,[1] there are five categories of voters, ranging from Uber Hawk to Uber Dove. We then assign numbers, ranging from one to five, with higher numbers signaling hawkishness. Overall, the average is moderate, with presidents being slightly more hawkish than governors . This year, the FOMC was a bit more dovish than the average of all potential voters. However, note that in 2023, hawks outnumbered doves five to four. Next year, the serving presidents are much more dovish. The average falls from 3.2 to 2.8, with doves outnumbering hawks five to four. The higher number of doves may make the “higher for longer” story harder to maintain.
One of the unusual characteristics of the Powell Fed has been the low number of dissents.
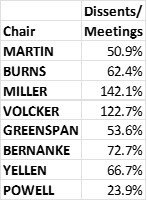 (Sources: Federal Reserve, Confluence)
This table measures the number of dissents relative to the number of meetings that a Fed chair has presided over. Clearly, Chair Powell has had the most unified FOMC in history. However, this upcoming year might be a challenge for Powell as his stated goal of keeping policy tight will be coming up against an FOMC that is more dovish than usual. If he maintains his dissent record, it will suggest his powers of persuasion are strong. It’s important to note that there is an unofficial rule that four governors dissenting at a meeting should trigger the resignation of the chair.[2] There are three dovish governors, so a moderate would have to vote against the chair in order to hit the critical fourth vote. We note that the last governor dissent was in 2005, so they have become rare. Thus, even one dissent would likely be newsworthy.
Overall, the composition of the FOMC in 2024 will lean dovish, while Chair Powell appears to be holding a hawkish line. At the last meeting, the FOMC dots plot took away two rate cuts from the 2024 projection. It remains to be seen whether those dots signaling a retreat from rate cuts are going to be voters next year. We may have a Fed that turns out to be more dovish than currently expected.
[1] Note that Governor Cook, who has recently been appointed, is colored in blue. This is because Bloomberg hasn’t given her an assessment yet.
[2] This is not a hard and fast rule, but a chair that is in the minority of the governors has probably lost the mandate to govern. For background, see Mallaby, Sebastian. (2016). The Man Who Knew: The Life and Times of Alan Greenspan. New York, NY: Penguin Books, pp. 311-315.
Weekly Energy Update (October 5, 2023)
by Bill O’Grady, Thomas Wash, and Patrick Fearon-Hernandez, CFA | PDF
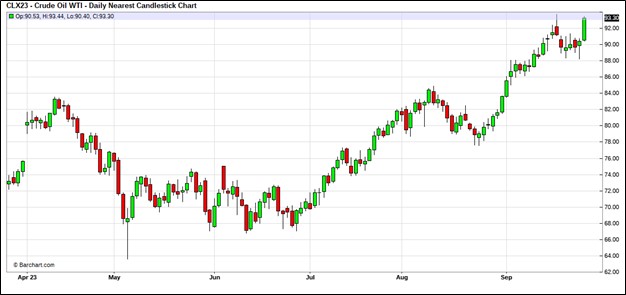
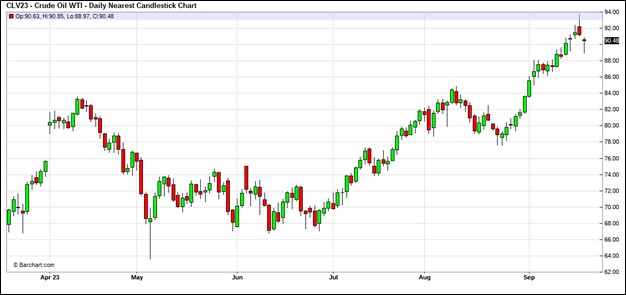
After making a run at $95 per barrel last week, prices are correcting; we suspect rising interest rates are increasing fears of an economic slowdown.
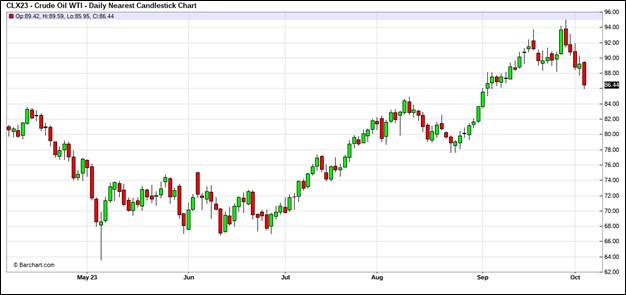 (Source: Barchart.com)
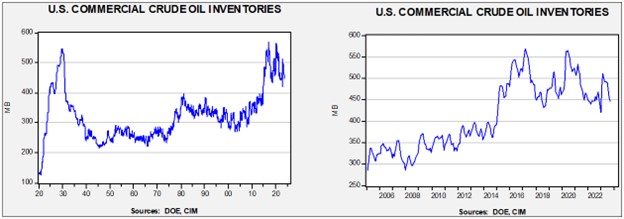
Commercial crude oil inventories fell 2.2 mb compared to forecasts of a 1.5 mb build. The SPR rose 0.3 mb, which puts the net draw at 1.9 mb (difference due to rounding).
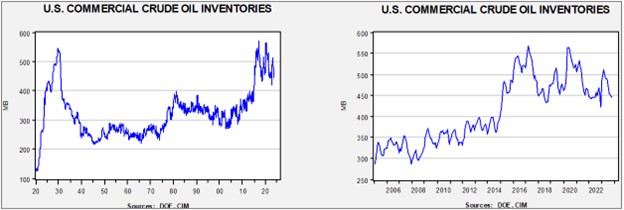
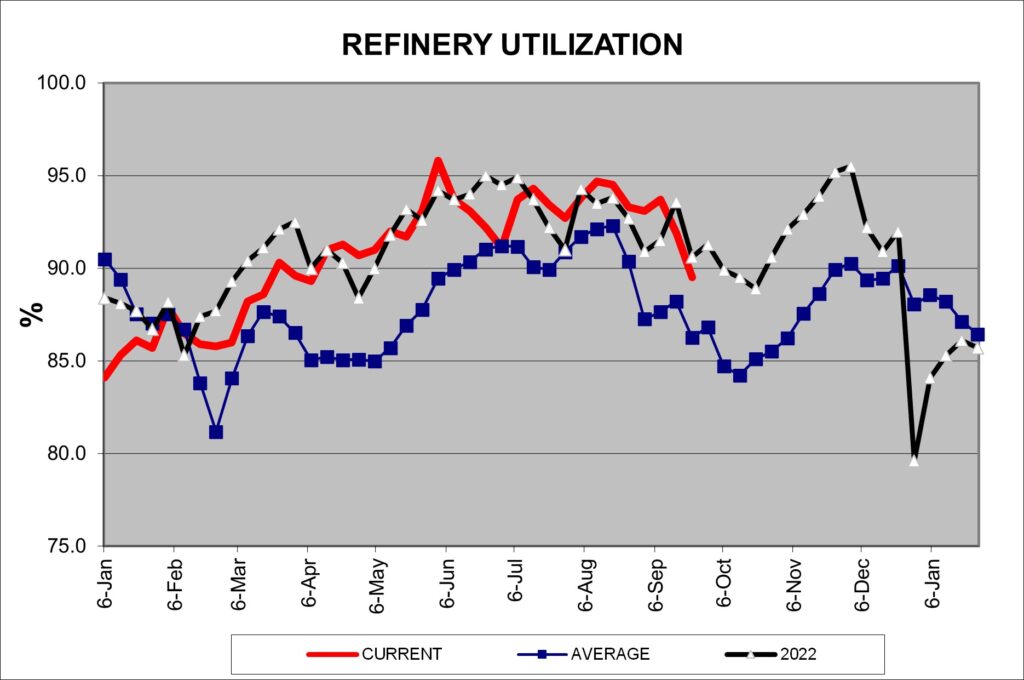
In the details, U.S. crude oil production was steady at 12.9 mbpd. Exports rose 0.9 mbpd, while imports fell 1.0 mbpd. Refining activity fell 2.2% to 87.3% of capacity. We are clearly heading into the autumn refinery maintenance period which should reduce demand.
 (Sources: DOE, CIM)
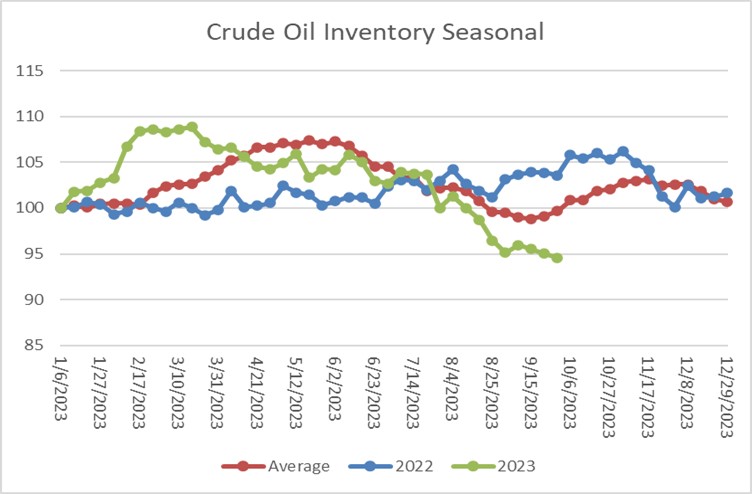
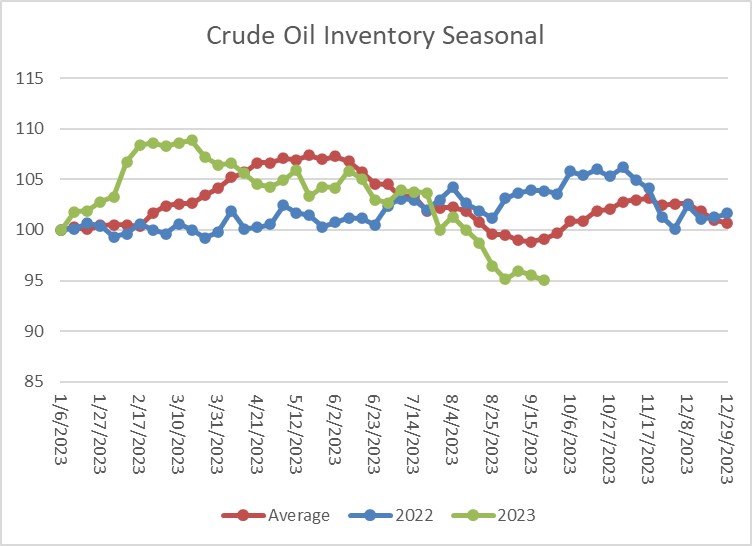
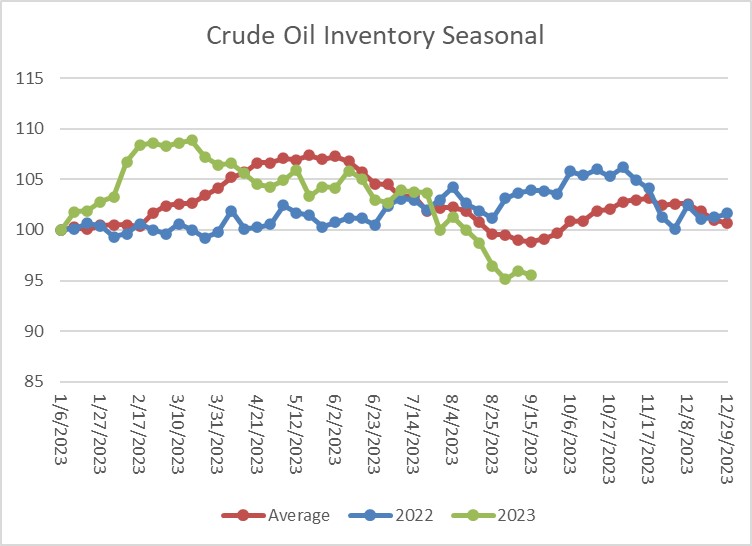
The above chart shows the seasonal pattern for crude oil inventories. Last week’s decline is contra seasonal and thus is bullish for crude oil prices. The continued drop in stockpiles while refinery maintenance is underway is profoundly bullish for oil prices.
 (Sources: DOE, CIM)
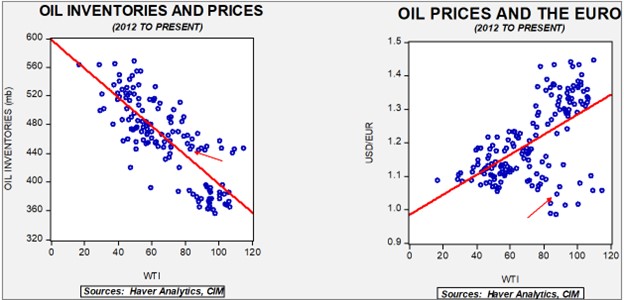
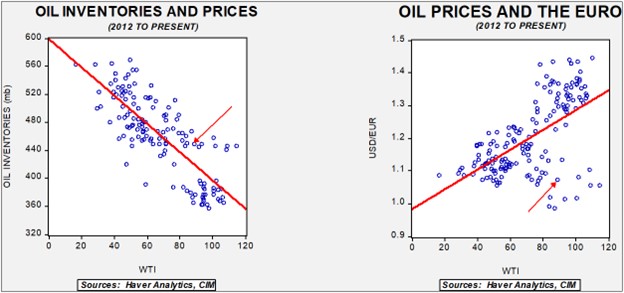
Fair value, using commercial inventories and the EUR for independent variables, yields a price of $76.55. The continued draw in commercial inventories is supportive for oil prices, but there is a geopolitical risk factor that is boosting prices as well.
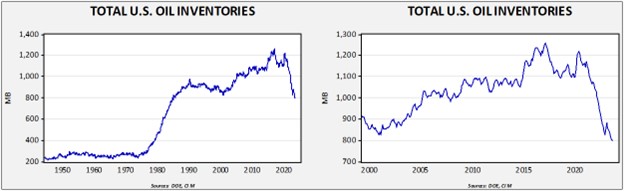
Since the SPR is being used, to some extent, as a buffer stock, we have constructed oil inventory charts incorporating both the SPR and commercial inventories.
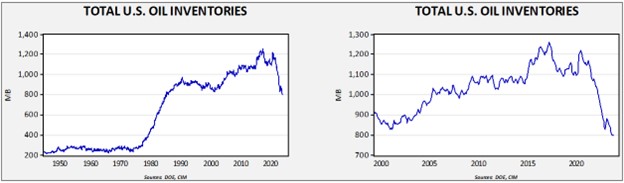
Total stockpiles peaked in 2017 and are now at levels last seen in late 1984. Using total stocks since 2015, fair value is $95.21.
Market News:
- Although there has been a clear trend by U.S. oil companies to focus more on profitability and less on production, surveys of oil executives suggest that they see oil demand continuing. So far, this hasn’t necessarily led to a major production boom. However, if these attitudes about demand begin to affect behavior, we could see renewed investment.
- At the same time, government hostility toward oil and gas continues. The Biden administration has reduced the number of offshore oil drilling leases to a record low. It should be noted that this stance could shift with a GOP White House, but the industry must consider the fact that power could shift back in later years. Policy uncertainty tends to dampen investment.
- Hedge funds are providing funding for environmental lawsuits. Although the funding, so far, has applied to mining firms, these lawsuits tend to raise the costs of production and reduce supply.
- U.S. product exports have hit a new record, and the same goes for U.S. exports of natural gas. As the global energy market restructures, the U.S. is benefiting.
- China is increasing its imports from the Arctic route.
Geopolitical News:
- With the spike in oil prices, the G-7 oil price cap has collapsed. This development is boosting Russian oil revenues. It should be noted that the vessels carrying Russian oil are not using Western insurance. So far, that hasn’t stopped their shipments. At the same time, Russian production of natural gas is falling as the loss of European markets and Western technology is undermining production.
- Turkey continues to play its role as a borderland nation. The number of Russian and Iranian firms locating to Turkey has surged since sanctions have been implemented in the wake of the war in Ukraine.
- Despite high oil prices, rising fiscal spending is expected to generate a deficit in the Kingdom of Saudi Arabia in 2024. It is unclear whether the Saudis will press for even higher prices to increase revenue. Obviously, this only works if the demand for Saudi oil is price inelastic.
- Saudi and Chinese energy ties are deepening. China is the world’s largest oil importer, and the Saudis are investing in China’s downstream industry. By doing so, it should increase China’s dependence on Saudi oil.
- There are reports that Iran has opened direct nuclear program talks with the U.S. Although getting to a deal would be difficult, the fact that Iran has moved on this issue could be significant.
- We also note that Tehran has been engaging in talks with various Gulf States.
- It’s looking increasingly likely that Robert Malley was involved in supporting Iranian diplomatic and intelligence efforts in Washington. As we note above, the Biden administration has been trying to resurrect the Iran nuclear deal; the revelation of a spy in the administration won’t help in this process.
Alternative Energy/Policy News:
- As we discussed last week, Ford (F, $12.54) has put a battery plant on hiatus due to uncertainty surrounding the facility’s profitability. Another issue looms regarding legislation on EV tax credits, which rests on how a “domestic” EV is defined. Foreign EVs or those with foreign components sourced from a “foreign entity of concern” will no longer be eligible for the credit. Ford is using Chinese-licensed battery technology, but the rest of the car is considered domestic. It is unclear whether Ford EVs will qualify if they use these batteries. Thus, the government’s decision on subsidies is a major issue for future domestically built EVs.
- Although the U.S. and increasingly the EU are using trade restrictions to support their domestic EV industries, there will be a cost to this protection in the form of higher prices. It’s a classic example of economic tradeoffs—if you want a rapid EV transformation, importing cars from China is probably the quickest path, but if you want to refashion the domestic auto industry, then consumers will pay more.
- EV makers outside of China are struggling to turn a profit. Tesla (TSLA, $245.26) has reported lower sales due, in part, to factory upgrades for next year’s models. The company has been trying to expand market share at the cost of margins, which has depressed revenue. Other firms are struggling as well.
- There is a near-constant debate as to whether EVs are better for the environment. Although they clearly reduce emissions, the mining of metals and the source of electricity can clearly affect the environmental situation. A new study suggests that even with assumptions that the electricity source is “dirty,” EVs are still a plus for the environment.
- Battery technology is evolving as research efforts increase. This research could change the types of metals needed for EV batteries over time.
- Emerging markets, in general, and China, in particular, are expanding nuclear power at a rapid pace. This development is bullish for uranium. In developed markets, permitting and other issues are undermining development.
- Nucor (NUE, $158.25) is looking to manufacture steel using fusion energy.
- As costs rise, growth in wind power is starting to stall.
- Global shipping firms are investigating the use of sails on vessels to reduce fuel consumption.
Bi-Weekly Geopolitical Podcast – #35 “The Oil Weapon Returns” (Posted 10/2/23)
Bi-Weekly Geopolitical Report – The Oil Weapon Returns (October 2, 2023)
Bill O’Grady | PDF
Oil is arguably the most critical commodity. Although food is perhaps more essential to life, most food production today is dependent on fossil fuels. Daniel Yergin’s epic history of oil, The Prize,[1] examines who had oil, who needed oil, and what they did to secure it. Due to oil’s importance, there has often been a geopolitical element to the commodity. We believe we are seeing yet another episode of oil being used for geopolitical purposes.
In this report, we open the discussion with two examples of using oil supplies for political purposes. Next, we offer a short history of oil in the Middle East. From there, we will examine recent developments. With this background in place, we will then look at how the power of oil affects presidential approval ratings. We will also show how OPEC+, especially the Kingdom of Saudi Arabia (KSA) and Russia, are using oil supplies to further their geopolitical goals. As always, we will conclude with market ramifications.
[1] Yergin, Daniel. (1991). The Prize: The Epic Quest for Oil, Money, and Power. New York, NY: Free Press.
Don’t miss our other accompanying podcasts, available on our website and most podcast platforms: Apple | Spotify | Google
Business Cycle Report (September 28, 2023)
by Thomas Wash | PDF
The business cycle has a major impact on financial markets; recessions usually accompany bear markets in equities. The intention of this report is to keep our readers apprised of the potential for recession, updated on a monthly basis. Although it isn’t the final word on our views about recession, it is part of our process in signaling the potential for a downturn.
The Confluence Diffusion Index declined for the first time in seven months in a sign that the economy is still not in the clear. The August report showed that seven out of 11 benchmarks are in contraction territory. Last month, the diffusion index declined from -0.1515 to -0.3333, below the recovery signal of -0.1000.
- Equities are losing steam due to concerns about monetary policy.
- Consumer sentiment is improving but confidence remains low.
- Despite a slowdown in hiring, the labor market remains tight.
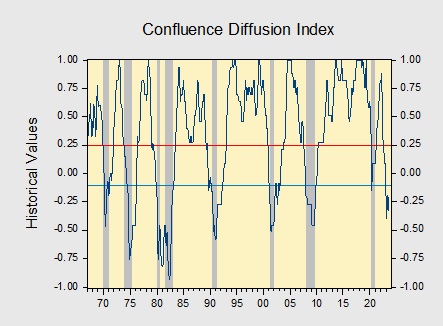
The chart above shows the Confluence Diffusion Index. It uses a three-month moving average of 11 leading indicators to track the state of the business cycle. The red line signals when the business cycle is headed toward a contraction, while the blue line signals when the business cycle is in recovery. The diffusion index currently provides about six months of lead time for a contraction and five months of lead time for recovery. Continue reading for an in-depth understanding of how the indicators are performing. At the end of the report, the Glossary of Charts describes each chart and its measures. In addition, a chart title listed in red indicates that the index is signaling recession.
Weekly Energy Update (September 28, 2023)
by Bill O’Grady, Thomas Wash, and Patrick Fearon-Hernandez, CFA | PDF
Oil prices are breaking out, raising the potential for a move toward $95 per barrel.
 (Source: Barchart.com)
Commercial crude oil inventories fell 2.2 mb compared to forecasts of a 2.0 mb build. The SPR fell 0.3 mb, which puts the net draw at 2.4 mb (difference due to rounding).
In the details, U.S. crude oil production was steady at 12.9 mbpd. Exports fell 1.1 mbpd, while imports rose 0.7 mbpd. Refining activity fell 1.6% to 89.5% of capacity. We are clearly heading into the autumn refinery maintenance period which should reduce demand.
 (Sources: DOE, CIM)
 (Sources: DOE, CIM)
The above chart shows the seasonal pattern for crude oil inventories. Last week’s decline is contra seasonal and thus is bullish for crude oil prices.
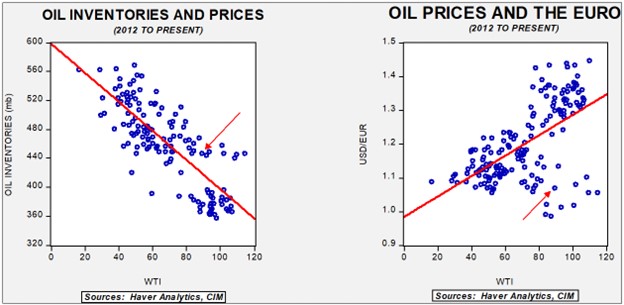
Fair value, using commercial inventories and the EUR for independent variables, yields a price of $74.92. Commercial inventory levels are a bearish factor for oil prices, but with the unprecedented withdrawal of SPR oil, we think that the total-stocks number is more relevant.
Since the SPR is being used, to some extent, as a buffer stock, we have constructed oil inventory charts incorporating both the SPR and commercial inventories.
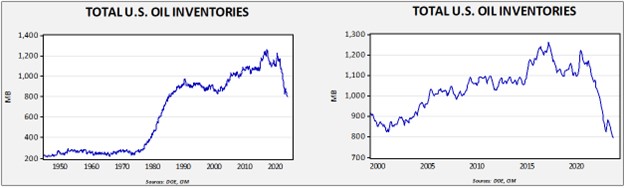
Total stockpiles peaked in 2017 and are now at levels last seen in late 1984. Using total stocks since 2015, fair value is $95.49.
Market News:
- The IEA issued an updated report detailing what would be necessary to reach carbon reduction goals by 2030. Generally speaking, it is still possible to reach these goals, but the path is narrowing. The IEA claims that fossil fuel demand will need to decline 25% by 2030; we suspect that isn’t likely.
- Oil execs claim that without more support for shale drilling, oil is headed to $150 per barrel. We don’t think that is probable in the near future because OPEC+ has significant excess capacity. However, over time, it could occur. The idea that demand must fall by 25% will likely temper investment activity in oil and gas.
- One of the key factors in shale production is water. There are concerns that Texas is consuming so much water that it may eventually curtail output.
- U.S. oil production is steadily rising and is offsetting some of the production cuts from OPEC+.
- As oil prices continue to rise, the G-7 cap on Russian oil prices has become irrelevant. The restrictions on Western insurance remain in place but are increasingly being ignored as Russia is managing to acquire insurance from other sources.
- Russia has banned product sales in a bid to ensure ample domestic supplies. Russian domestic prices have declined in the wake of the restrictions.
- Although there is still talk about phasing out fossil fuels in the West, China’s climate envoy has made it clear that Beijing isn’t ready to give up on these fuels anytime soon. This comment makes the idea of “peak oil demand” appear a bit premature.
- It was a warm summer, and September has also been warm. The combination of undersea volcanic activity, the emerging El Niño, and the peak of the solar cycle have all combined to lift summer temperatures. We will now be watching to see if we have a mild winter as a continuation of these trends.
- Russia banned the export of distillate products earlier this month, but as prices have increased, it has lifted its ban on bunker fuel, the high-sulfur fuel usually burned by ships.
- Despite high prices, U.S. E&P company capex remains constrained.
Geopolitical News:
- In the wake of the Iran/U.S. prisoner swap, there is hope that the two parties will use this event to improve relations. Although we have our doubts that this will work, there are parties trying to foster negotiations.
- Qatar is offering to facilitate talks between the U.S. and Iran about moving forward on a new nuclear deal.
- On the other hand, Iran’s foreign minister, who was in New York for the UN General Assembly meetings, was unable to visit Washington for talks.
- Robert Malley, who we discussed in an earlier Weekly Energy Update, appears to be part of a deep influence campaign by Iran.
- President Raisi of Iran is calling for the U.S. to leave the Middle East.
- Iran claims to have thwarted a massive bombing campaign. Tehran blames Israel.
- In a bid to conserve foreign currency reserves, Iraq will restrict all internal transactions to the IQD. Usually when a central bank puts such restrictions in place, the action reduces trade.
- Over the past few weeks, we have discussed Saudi/Israeli normalization. The barriers to a deal remain high, but talks appear to be continuing. As a potential deal looms, Iran is trying to figure out how to respond. A KSA/U.S./Israel deal would create a formidable obstacle to Iran’s goal of dominating the region.
- As negotiations continue, we note that the new Saudi envoy to the Palestinians has visited the West Bank. Also, Israel’s tourism minister has visited the KSA, which makes the minister the highest ranking official to actually visit Saudi Arabia.
- One of the key elements of the geopolitics of oil is that Europe lacks enough oil and natural gas to be energy independent. Thus, it needs imports to meet its energy needs. The U.S. wants Europe to be dependent on America. Europe, obviously, wants diversity of sources. Washington has historically tolerated Europe getting supplies from the Middle East and Africa but has consistently opposed Europe getting oil and gas from Russia. As the war in Ukraine has disrupted Russian supplies, the EU is finding itself increasingly dependent on the U.S., especially for natural gas.
- Mexico is planning to join the ranks of LNG export nations.
- Chevron (CVX, $170.23) announced it will resume drilling activity in Venezuela. The country has been under sanction for some time, but in the wake of the war in Ukraine, Washington has gradually lifted sanctions in a bid to keep oil prices under control.
- At the same time, Citgo, the large U.S. refiner that is a subsidiary of the Venezuelan state oil company PDVSA, will be auctioned off to pay Venezuelan debt. So far, the Maduro government hasn’t taken measures to stop the sale.
Alternative Energy/Policy News:
- European officials warn that the region must diversify its solar panel supply chains away from its dependence on China. The U.S. industrial policy is attempting to support a domestic solar panel industry.
- The EU is getting increasingly aggressive in protecting its auto industry, threatening not only China but also U.S. EV producers with trade restrictions.
- China is also dominant in rare earths mining and processing. Vietnam is vying to compete with China in this market.
- Vietnam is also making headway in the EV market and hopes to become a source for the EU now that Europe is considering restricting Chinese EVs.
- Ford (F, $12.55) halted work on a battery plant in Michigan. The plant, which uses Chinese licensed technology, has been controversial. The UAW, which is currently striking, has claimed that this halt was designed to influence the union’s wage efforts. However, the company claims it isn’t sure it can “competitively” operate the plant.
- Chinese firms are investing in Moroccan phosphate, which they use in batteries.
- Looking for a good primer on EV batteries? This report from The Economist lays out the different battery technologies and where new developments are going.
- Geothermal energy remains an attractive alternative energy. So far, it has mostly been restricted to regions with volcanic activity but there are hopes that it can be deployed more broadly. In addition, there is research under way to make current geothermal power more efficient.
- There is also research in progress that could transform CO2 into synthetic natural gas.
- The U.S. is aiming to build a nuclear fusion facility within the next decade.
- Microsoft (MSFT, $310.65) is funding small modular reactors to provide energy to the company. This energy is designed to, in part, provide electricity for its AI efforts.
Asset Allocation Bi-Weekly – Where’s the Recession? A Recap (September 25, 2023)
by the Asset Allocation Committee | PDF
Precise recession forecasting is really difficult. Most recessions occur during periods of tightening monetary policy; however, history shows that monetary policy works with “long and variable lags,” meaning that the impact of rising interest rates doesn’t lead to consistent timing of downturns. It’s a bit like wanting to schedule an outdoor event over the next 10 days, and the weather forecaster tells you it could rain in an hour or over the next 30 days. It’s highly likely that he will be correct, but that forecast is useless for your scheduling purposes. For investors, the key time frame for a recession warning is probably six to nine months. Financial markets can continue in a “risk-on” mode for a year to 18 months before a recession and so getting overly defensive can hurt returns. On the other hand, getting a very late warning may not give an investor enough time to adjust portfolios.
In our 2023 Outlook, we suggested a recession this year was “highly probable.” We could still be right, but it is clear that the clock isn’t in our favor. In recent Asset Allocation Bi-Weekly reports, we have discussed various reasons why the economy has avoided a recession. For the most part, the economy has been less sensitive to higher interest rates, and these reports discuss why. In this report, we will recap those reports to create a guidepost of what could bring about a recession. For example, if a factor is still in place, it likely would suggest the recession could be further delayed. On the other hand, if that condition is changing, a recession might be on its way.
“The Case for New Home Sales” (May 22, 2023): One of the primary conduits of tighter monetary policy to slow the economy is through the housing market. Given the sharp rise in mortgage rates when we wrote our outlook, we were worried about a decline in home prices as such declines have historically been tied to serious downturns. However, as mortgage rates rose, existing homeowners have stayed put. Homebuyers are buying more new homes and homebuilders are accommodating these buyers with less expensive homes and by helping with purchases. Until some factor, such as rising joblessness, forces current homeowners to sell, this situation is likely to continue. Our take: This factor will likely continue to delay the recession.
“The Green Shoots of Re-Industrialization” (July 3, 2023): As the world deglobalizes, the U.S. is reindustrializing. Far-flung supply chains, often in nations now deemed hostile, are leading companies, supported by policymakers, to build industrial capacity in the U.S. Private non-residential construction has been rising sharply. Given that various policies, such as the CHIPS Act and the Inflation Reduction Act, are just starting to have an effect, this support is in its early stages. Our take: This factor will likely continue to delay the recession.
“Are Higher Interest Rates Bearish for Risk Assets?” (July 17, 2023): Higher interest rates are expected to slow borrowing. We are starting to see rising delinquencies for credit card debt and auto loans. However, there has been a rise in interest income for savers. After years of chasing yields in the more risky and esoteric parts of the financial markets, savers are now getting attractive interest rates on low-risk assets, such as T-bills. This factor may not delay the recession, but it may reduce the downside risk for risk assets. Why? The primary beneficiaries of this rising interest income are the wealthy, who also are the majority owners of equities. Our take: This may not delay the recession but could reduce the risk from one to markets.
“Where’s the Recession? Examining Employment” (August 14, 2023): In this report, we note that the labor markets received a shock from the pandemic. The 55+ labor force and employment fell well below trend. COVID-19 is particularly risky for older people, and we estimate that if this part of the labor market had remained on its pre-pandemic trend, the unemployment rate would be 4.9%. There is no evidence yet to suggest these workers are returning at a pace equal to the pre-pandemic trend. The impact on the labor market could be mitigated through immigration, but labor markets over the next few months will likely remain tighter than they otherwise would have been. Our take: Employers are adjusting to the lack of labor. Although strike activity is elevated, there are also reports of wage cuts which would suggest employers are adjusting. This factor should remain in place, but its impact does appear to be waning. Thus, it may not delay a downturn much longer.
“Fiscal Tightening Looms” (September 11, 2023): The level of fiscal support has delayed the recession. The fiscal deficit has widened because of higher spending and falling tax revenue (partly due to the indexing of marginal tax rates; as inflation rose, the tax brackets shifted up). However, the moratorium on student debt repayments is coming to an end this month. The Biden administration has tried to soften the blow, but borrowers will be servicing their student loans again, which will reduce the spending power of the affected households. Our take: This is a worry. There is some evidence to suggest that these households assumed that the loan payments would never return and thus borrowed to fund other purchases. If that is correct, this issue could accelerate a downturn.
Overall, the factors that we have highlighted in recent weeks suggest that the recession probably is an issue for 2024. Tightening fiscal policy is the only real worry, although some of this tightening will likely be offset by re-industrialization. The metrics on homes is not good; affordability is weak, but without a factor that forces sales of existing homes, we are probably looking at a mostly soft housing market. It’s worth noting that residential real estate has had a negative contribution to GDP for nine consecutive quarters. So, it’s not like residential housing is boosting the economy; instead, it is mostly not causing balance sheet problems for households.
Weekly Energy Update (September 21, 2023)
by Bill O’Grady, Thomas Wash, and Patrick Fearon-Hernandez, CFA | PDF
Oil prices have continued their rise, with Brent trending toward $95 per barrel. Recent extensions of the production cuts by the Kingdom of Saudi Arabia (KSA) have boosted prices.
 (Source: Barchart.com)
Commercial crude oil inventories fell 2.1 mb compared to forecasts of a 1.7 mb draw. The SPR rose 0.6 mb, which puts the net build at 1.5 mb.

In the details, U.S. crude oil production was steady at 12.9 mbpd. Exports rose 2.0 mbpd, while imports fell 1.1 mbpd. Refining activity fell 1.8% to 91.9% of capacity.
 (Sources: DOE, CIM)
The above chart shows the seasonal pattern for crude oil inventories. Last week’s decline is mostly consistent with expected seasonal patterns. However, we should start to see inventories rise in the coming weeks, but if they fail to do so, it could give another lift to oil prices.
Fair value, using commercial inventories and the EUR for independent variables, yields a price of $74.10. Commercial inventory levels are a bearish factor for oil prices, but with the unprecedented withdrawal of SPR oil, we think that the total-stocks number is more relevant.
Since the SPR is being used, to some extent, as a buffer stock, we have constructed oil inventory charts incorporating both the SPR and commercial inventories.
Total stockpiles peaked in 2017 and are now at levels last seen in late 1984. Using total stocks since 2015, fair value is $95.20.
Market News:
- Last week, we reported on the IEA’s position that peak oil demand is near. We note that this week, skeptics to this idea have responded.
- Société Générale (SCGLY, $5.16) announced it is scaling back its lending to the fossil fuel industry. Reducing available capital to the energy industry is bullish for crude oil prices.
- Although we remain concerned about European natural gas prices this winter, current inventory capacity is essentially full, meaning that LNG cargos destined for Europe have no place to go. Thus, in the near term, prices could come under pressure.
- It appears that China is rapidly building crude oil inventories. Although we don’t know the prices at which the oil was acquired, we are surprised China has been aggressively buying oil in a highly priced environment. We do note that the largest exporter of oil to China is Russia; Moscow has likely given Beijing favorable prices and is allowing China to purchase oil in CNY.
- Ireland has rejected plans to build an LNG terminal, citing its goal of reducing greenhouse gases. It remains to be seen if Ireland can meet its energy needs through other means.
- Although overall U.S. production has been rising, the DOE says that output from leading shale oil areas has fallen for three consecutive months.
- California is putting restrictions on diesel semis starting next year, which is leading trucking companies to aggressively acquire rigs before the deadline.
Geopolitical News:
- The five Americans held in Iran have left Tehran. Despite this diplomatic effort, tensions with Iran remain elevated. Iran has expelled around one-third of IAEA inspectors in what is being called an “unprecedented” action. The move will likely slow, or even prevent, further improvement in relations. We note that European nations have decided to maintain sanctions, suggesting the prisoner swap was a one-off. At the same time, there are hopes that this confidence-building measure could lead to improved relations.
- The Saudi oil minister claims that the recent cuts in production were required to “stabilize” the oil market and were not about raising prices. If so, the oil price chart shown earlier would suggest this effort was an abject failure.
- As tensions rise between Armenia and Azerbaijan in the Nagorno-Karabakh region, there are worries that the Baku oil flows could be interrupted. Fortunately, it looks like a ceasefire has been negotiated.
- There are unconfirmed reports that the KSA has ended talks with Israel on normalizing relations. Israel says negotiations continue.
- Meanwhile, the U.S. is trying to facilitate talks between the KSA, the UAE, and the Houthis on a ceasefire in the Yemen Civil War. Although the KSA and UAE both endorse suppressing the Houthis, they support different groups in Yemen. Thus, the negotiations will be difficult. A ceasefire in Yemen could help stabilize the region.
- In the U.S., as the Democratic Party supports the expansion of green energy, the GOP appears to be increasing its support for the fossil fuel industry…and looking for campaign donations.
- We have noted that the Russian oil and gas embargo has led to a restructuring of global energy flows. This report details recent trends.
Alternative Energy/Policy News:
- Wind energy has recently come under strain as rising costs are leading to projects being postponed or cancelled. Governors on the Atlantic Seaboard are asking for federal help to keep the projects afloat.
- Last week, we noted that the EU is starting to push back against Chinese EVs in a bid to protect their own auto industry. It looks like this pushback is gaining momentum. As the EU starts to close its market, China is eying Japan as a target for its EVs.
- The state of California is suing major oil companies for damages caused by climate change, alleging the firms covered up evidence that fossil fuel consumption would have adverse climate effects. We have no position on the merits of the case, but would suggest that its existence alone could have a dampening effect on future oil production.
- Although the long-term outlook for lithium is bullish, in the near term, supply exceeds demand. Thus, we may be in for a period of falling lithium prices.
- Oil companies are looking to extract lithium from fracking wastewater.
- Researchers at Princeton have developed a new lithium extraction process that promises to enhance the productivity of the metal.
- One important hurdle for EVs is range anxiety. Energy Secretary Granholm’s recent EV demonstration trip was a mess; securing recharging venues was hard and they were not in the most convenient spots. However, it should be noted that we are in the early days of the EV era. Next generation batteries could go a long way toward addressing current problems. Toyota (TM, $187.86) claims its next generation battery will have a range of 497 miles, which rivals gasoline engines. The company says that it will offer solid state batteries by the end of the decade with ranges around 920 miles and 10 minute recharges.
- U.S. EVs have reached two million on the road.
- To acquire key minerals for the energy transition, Norway wants to mine the seabed. We suspect this will be controversial.