Asset Allocation Weekly (May 12, 2017)

by Asset Allocation Committee

Slow economic growth has plagued the West.  Although the concern has been acute since the Great Financial Crisis (GFC), worries about slowing growth predated that event.  Perhaps the most important factor contributing to sluggish growth has been tepid productivity growth.

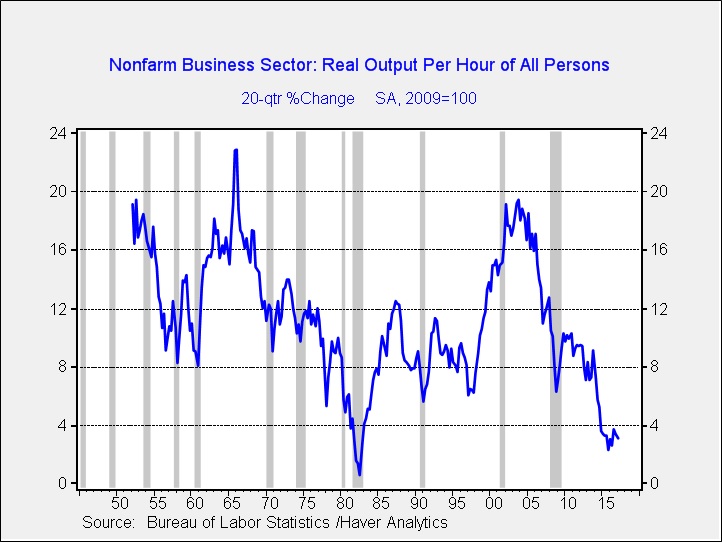
This chart shows the five-year change in productivity; we use this longer term rate of change to more clearly show the trend in productivity growth.  As the chart indicates, productivity growth is remarkably weak; in fact, in the postwar era, only the weakness seen in the depths of the 1981-82 recession recorded lower productivity growth by this measure.

Economic theory holds that production comes from the combination of land, labor, capital and entrepreneurship.  Most models focus on capital and labor.  The Cobb-Douglas production function[1] is a canonical expression of how economists think about forecasting output.  Production is the combination of capital and labor, scaled by productivity.  If productivity is constant, growth comes by adding capital (investment in plant and equipment, etc.) and workers (or, specifically, hours worked).  If an economy increases its productivity, more output is gained for each additional unit of labor and capital.  That’s why falling productivity is such a problem; it means that additional labor and capital resources must be deployed just to keep production steady.

Productivity is something of the holy grail of economics.  Theories of what boosts productivity abound; deregulation and competition are thought to increase it, supporting entrepreneurship with low taxes could be a factor, education and immigration could support increases and, of course, technological progress is a necessary ingredient.  However, no economist has yet been able to definitively say what causes productivity to universally rise under all conditions.

However, we can say that an economy with weak productivity growth will struggle.  Capital and labor essentially divide total output and low productivity makes that division difficult.  On the other hand, rising productivity can allow both capital and labor to enjoy a rising absolute share of output.  Social peace is much easier to achieve with rising productivity.  It is probably no accident that the rise of populism in the West has coincided with weak productivity growth.

From the mid-1970s into the GFC, the relationship between corporate profits and the five-year growth rate of productivity was fairly consistent.

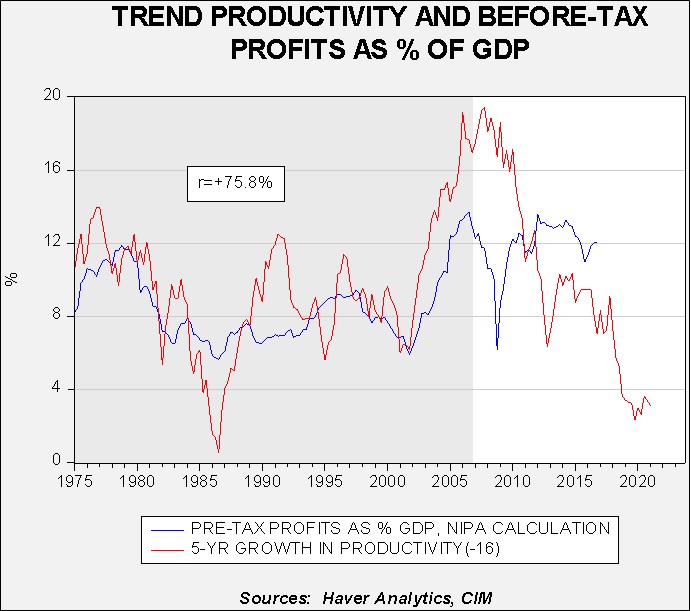
This chart shows pre-tax corporate profits, on a national income product accounts basis, as a percentage of GDP along with the five-year growth rate of productivity.  From the mid-1970s into 2007, the two series were highly correlated at 75.8%, with trend productivity leading profits by four years.  Since 2007, the two are inversely correlated at the 53.3% level.  Clearly, profits have remained elevated despite weak trend productivity, which begs the question—how did profits hold up in the face of falling productivity?

What has occurred is that relative labor compensation has fallen.

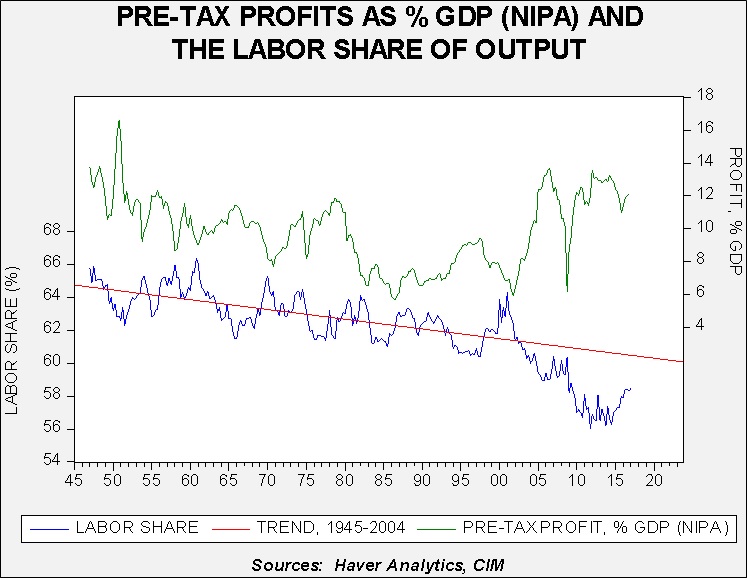
The upper line on this chart shows pre-tax profits as a percentage of GDP.  The lower line shows labor’s share of output along with a time trend calculated from 1947 to 2004.  From 1947 through 2004, the share held fairly steady; although there was a clear downtrend, the slope was fairly benign.  Clearly after 2004 the share fell well below trend, and the labor share plummeted after the GFC.  It has recovered some of its losses since 2015 but the data is still well below trend.  A falling share to labor has allowed firms to overcome weak productivity trends and retain high margins.

Why has labor’s share of output declined?  The media discusses a litany of reasons…technology and globalization have given firms market power over labor and allowed companies to keep wages contained despite tightening labor markets.  Although this condition has been a boon for profit margins, it has been difficult for workers and we suspect the rise of populism is a direct result of wage pressures.

As the first chart shows, because of the lagged effect of trend productivity, the effects of weak productivity will become acute starting around mid-2018.  Without a decline in the labor share of output, profit margins will come under growing pressure.  Using a simple regression of trend productivity and labor share, to maintain pre-tax profits of 12% would require the labor share to fall to 55% by the end of 2018.  If the labor share remains constant, profit margins will decline to 9.6% of GDP.  This level is still historically high but, given market expectations of continued strong profit margins, even this decline will be problematic.

The Trump administration continues to straddle the line between a traditional GOP stance that favors business and capital and a populist variant that calls for trade protection and immigration restrictions.  If President Trump decides to favor his working class supporters, which would likely boost the labor share, profit margins would come under even more pressure.  This is a factor we will be monitoring closely as the year progresses.

View the PDF

_______________________________

[1] P(L, K) = bLαKβ, where:  • P = total production (the monetary value of all goods produced in a year) • L = labor input (the total number of person-hours worked in a year) • K = capital input (the monetary worth of all machinery, equipment and buildings) • b = total factor productivity • α and β are the output elasticities of labor and capital, respectively.  These values are constants determined by available technology.

Daily Comment (May 12, 2017)

by Bill O’Grady, Kaisa Stucke, and Thomas Wash

[Posted: 9:30 AM EDT] Although the Comey situation continues to dominate the news flow, we are reaching the point where there isn’t really anything new.  So far, the financial markets are managing the situation calmly.

The U.S. and China announced a trade agreement.  On its surface, it doesn’t look like it will affect the overall trade deficit but it will boost two key constituents for the president—energy and agriculture.  The ban on beef exports will be lifted; the Chinese had implemented a partial ban after the “mad cow” scare 14 years ago.  It appears that the beef market has probably anticipated this action.

(Source: Barcharts.com)

Prices jumped but have fallen off their highs.  In addition, the U.S. will be able to export LNG to China, although it isn’t obvious that this change will result in any major exports immediately.  China already has sources in Asia and the U.S. is still building the infrastructure for gas liquefaction.  One item left out was any language about the U.S. allowing Chinese firms to invest in the natural gas industry.  The U.S. also said it “recognizes the importance of the [one belt, one road] initiative.”  Negotiating a deal, even a modest one, shows that the administration can move forward on policy even amidst controversy.

China has been steadily tightening monetary policy and it’s starting to show up in the term structure.  The five-year/10-year yield curve has inverted, although we are not sure this really matters.  However, we are seeing a rapid narrowing of the one-year/10-year yield curve, which is probably more significant because it highlights the impact of policy tightening.

(Source: Bloomberg)

We have seen this curve invert before, in mid-2013, driven by a spike in the one-year rate.  However, the rise in the short rate was brief.  As the lower line on the chart shows, the curve in China is flattening.  In most economies, an inverted yield curve is a clear signal of future economic contraction.  As the chart shows, policymakers in China tend to back away from policy tightening once the curve moves to flatten; we wouldn’t be surprised to see similar behavior this time, either.  But, if the PBOC continues to ratchet rates higher, we will soon be approaching a level of concern.

Reuters is reporting that the administration is “weeks” away from appointing new governors to the FOMC.  Currently, there are three governor openings.  Appointing governors to the FOMC is perhaps the second most important appointment a president gets to make, overshadowed only by the Supreme Court.  Who gets these jobs will have an important impact on monetary policy.  The Bannon wing will likely want to appoint dovish governors, while the Cohn wing would lean toward hard money types.  Media speculation has trended toward hawks.  Since appointments are weeks away, the earliest any of these seats could be filled is autumn.  We do also expect both Yellen and Fischer to exit in Q1 2018, so President Trump will get to appoint up to five of the seven governors in his term.

With the release of the CPI data, we can upgrade the Mankiw models.  The dip in the core CPI rate (see below) did affect the Mankiw Rule model results.  The Mankiw rule models attempt to determine the neutral rate for fed funds, which is a rate that is neither accommodative nor stimulative.  Mankiw’s model is a variation of the Taylor Rule.  The latter measures the neutral rate using core CPI and the difference between GDP and potential GDP, which is an estimate of slack in the economy.  Potential GDP cannot be directly observed, only estimated.  To overcome this problem with potential GDP, Mankiw used the unemployment rate as a proxy for economic slack.  We have created four versions of the rule, one that follows the original construction by using the unemployment rate as a measure of slack, a second that uses the employment/population ratio, a third using involuntary part-time workers as a percentage of the total labor force and a fourth using yearly wage growth for non-supervisory workers.

Using the unemployment rate, the neutral rate is now 3.29%.  Using the employment/population ratio, the neutral rate is 1.13%.  Using involuntary part-time employment, the neutral rate is 2.60%.  Using wage growth for non-supervisory workers, the neutral rate is 1.15%.  Although the labor market data for April improved, the fall in the core CPI rate offset most of those gains, leading to lower projected rates for all models.

What is notable is that for two of the variations, wage growth and the employment/population ratio, the FOMC is nearly at a neutral rate now.  The fact that policymakers appear driven to lift rates further suggests they are more concerned with either involuntary part-time employment or the unemployment rate.

Since the Great Financial Crisis, it has been unclear which measure of employment accurately characterizes the labor market.  Because the Fed was conducting very easy monetary policy, the debate was mostly academic; that isn’t the case anymore.  If the accurate measure is the employment/population ratio or wage growth but the Fed thinks either the unemployment rate or involuntary part-time employment is the correct indicator of slack, policymakers would run the risk of overtightening and risking a recession.

This chart shows the issue; this is the Mankiw model variation using wage growth.  The lower line on the chart shows the deviation from the neutral rate as projected by the model.  When the rate is below zero, policy is leaning toward accommodative.  Note the parallel lines on the lower part of the chart; these lines measure a standard error on either side of the neutral rate.  When the deviation is within the parallel lines, it suggests policy is mostly neutral.  Thus, based on wage growth, we are close enough to neutral policy that the Fed could stand pat until either wage growth accelerates or core CPI rises.

Thus, the coming months will be key.  If this model is the most accurate measure of slack then the Fed needs, at most, one more hike.  Policy would be tight at a fed funds target of 2.40%, so there is some element of tolerance that the economy should be able to manage.  Based on the dots chart, we would be at this level by the end of next year.  Simply put, we could be approaching a period where monetary policy shifts to a headwind.

View the complete PDF

Daily Comment (May 11, 2017)

by Bill O’Grady, Kaisa Stucke, and Thomas Wash

[Posted: 9:30 AM EDT] Media attention remains on the Comey firing.  On this issue, there are three stories we view as notable this morning.

Deputy AG Rosenstein threatened to resign: The WP[1] is reporting that the deputy AG threatened to resign as the narrative emerging from the White House was that the president was simply following the recommendations of the DOJ.  This highlights an emerging characteristic of this presidency.  When things go well, the president takes full credit.  When something goes wrong, an underling is blamed.  It’s a far cry from President Truman’s “the buck stops here.”[2]  All presidents demand some degree of loyalty.  The same is true of all leaders.  An organization will struggle to perform its mission without some level of loyalty.  However, it cannot be the primary virtue because it can lead to abuses; loyalty to the organization becomes an excuse for the end justifying the means.[3]  President Trump appears to put great emphasis on loyalty and the decision to fire Comey is creating a narrative that the primary reason was concern that Comey was not loyal and could not be controlled by the White House.[4]

The optics of meeting with Russian officials looks like an “own goal”: The White House did not allow the U.S. press to cover Trump’s meeting with Russian Foreign Minister Lavrov and Russian Ambassador to the U.S. Sergei Kislyak.  However, the Russian media apparently did get a photo of the president and the two Russian officials.  Under normal circumstances, such meetings are not news—presidents meet with foreign officials as part of the job.  However, the timing of this one is unfortunate.

(Source: AP via the Russian Foreign Ministry)

Polls are slipping: Quinnipiac released a poll[5] yesterday showing rising disfavor with the president.  This isn’t exactly news in that Trump hasn’t usually polled all that well.  However, one of the characteristics of the Quinnipiac polls is that they ask the same questions over a number of weeks so one can observe trends.  Here are a few interesting observations.  In handling the job as president, “strongly disapprove” has moved from 40% to 51% since late January.  The “favorable/unfavorable” responses have seen favorable deteriorate from 44% in late November to 35% now and unfavorable rise from 46% to 58%.  The “honest/dishonest” responses have dropped honest from 42% to 33% (November to now), while dishonest has risen from 52% to 61%.  On the question of leadership as “good/bad,” good has declined from 56% to 41% (November to now), and bad has risen 38% to 56%.  Perhaps the most troubling were the responses to whether “Donald Trump cares about Americans”; yes has fallen from 51% to 38% (November to now), while no has risen from 45% to 59%.  Why does this matter?  The ability to get legislation through Congress needs presidential leadership.  If members of Congress begin to view the president as a political liability, it becomes difficult to move legislation through Congress.  President Obama faced similar issues at the midterms of 2014; Democrat candidates didn’t want him campaigning with them.[6]  It’s also noteworthy that the Obama administration was unable to move major legislation through Congress after 2014 in part due to his unpopularity.  The more unpopular Trump becomes, the quicker his political capital will be depleted.  That means tax reform, infrastructure spending, etc. will not move forward.

Meanwhile, the Fed appears on a path toward at least two more rate hikes this year.  Boston Fed President Rosengren, a reliable dove, indicated yesterday that he sees three more hikes this year.  The financial markets haven’t discounted tightening of this magnitude so this could become a risk factor as the year wears on.

U.S. crude oil inventories fell 5.3 mb compared to market expectations of a 2.2 mb draw.

This chart shows current crude oil inventories, both over the long term and the last decade.  We have added the estimated level of lease stocks to maintain the consistency of the data.  As the chart shows, inventories remain historically high but the seasonal withdrawal phase has begun.  We also note that, as part of an Obama era agreement, there was a 0.5 mb sale of oil out of the Strategic Petroleum Reserve.  This was part of a $375.4 mm sale (or 8.0 mb) done, in part, to pay for modernization of the SPR facilities.  International agreements require that OECD nations hold 90 days of imports in storage.  Due to falling imports, the current coverage is near 140 days.  Taking that into account, the draw would have been 5.8 mb, which is even more below expectations.

As the seasonal chart below shows, inventories usually are at their seasonal peak and begin falling about now.  This year, the seasonal decline has started early.  Although inventories remain high, this seasonal level is consistent with July, meaning that we may be on the way to an easing of the inventory overhang.  Last year, we saw a roughly 45 mb draw from the April peak.  Assuming a similar drop from this year’s peak of 566.5 mb at the end of March, we will end up at 520 mb by late September.

(Source: DOE, CIM)

Based on inventories alone, oil prices are overvalued with the fair value price of $33.71.  Meanwhile, the EUR/WTI model generates a fair value of $46.04.  Together (which is a more sound methodology), fair value is $42.04, meaning that current prices are above fair value but the deviation has been steadily closing in recent weeks.  We note that OPEC looks like it will keep production cuts in place into next year, which probably keeps oil in a range of $55 to $45, basis WTI.

View the complete PDF

_____________________________________

[1] https://www.washingtonpost.com/politics/how-trumps-anger-and-impatience-prompted-him-to-fire-the-fbi-director/2017/05/10/d9642334-359c-11e7-b373-418f6849a004_story.html?utm_campaign=newsletter_axiosam&utm_medium=email&utm_source=newsletter&utm_term=.64858ef5cc41

[2] https://qph.ec.quoracdn.net/main-qimg-edc462fee894f545efa2db00e65b86c9-c

[3] One of the best works on balancing loyalty in an organization comes from Herbert Simon. See: Simon, H.A. (1945). Administrative Behavior. New York, NY: The Free Press.

[4] https://www.nytimes.com/2017/05/10/us/politics/how-trump-decided-to-fire-james-comey.html?_r=0

[5] https://poll.qu.edu/national/release-detail?ReleaseID=2456

[6] http://time.com/3507165/alison-grimes-barack-obama-midterm-elections/

Daily Comment (May 10, 2017)

by Bill O’Grady, Kaisa Stucke, and Thomas Wash

[Posted: 9:30 AM EDT] The story dominating this morning’s headlines is the Trump administration’s decision to fire FBI Director Comey.  There is much speculation surrounding what is going on with the decision; our focus will remain on the impact on financial markets.  So far, it hasn’t had much of an impact.  S&P futures are flat, Treasuries are modestly stronger and the dollar is mostly steady.  Here are a few of our thoughts:

FBI directors rarely survive their terms.

(Source: Statista, https://www.statista.com/chart/9322/few-fbi-directors-survive-the-full-10-years/)

 Of course, the first FBI director, J. Edgar Hoover, served from the bureau’s founding in 1935 until his death in 1972.  Hoover was a controversial figure and after his death presidents wanted to regain control of the FBI.  Nixon initially appointed Patrick Gray as acting director following Hoover’s death.[1]  Later, Clarence Kelly was appointed to the position as full director.  Directors are given 10-year terms with the idea that they will be insulated from political influence; that hasn’t worked according to plan.  With his firing, Comey has now served the shortest term in the bureau’s history.

The FBI has great power; it is essentially the U.S. equivalent of MI-5, engaging in not only Federal policing but also domestic counterintelligence.  Hoover lasted as long as he did because presidents were afraid of the political fallout from removing him from office.  Any removal of an FBI director is fraught with risk.

The firing could become a significant distraction.  Concerns about Russian involvement in the presidential campaign is a story that simply won’t go away.  Our position is that election interference is nothing new.  The Soviets tried to keep Reagan from getting elected; recently, President Obama not only endorsed Emmanuel Macron but also recorded a message to French voters.  However, there is a line between trying to sway an election and influencing a government.  If government officials are compromised by a foreign power, the danger is immense.  Gen. Flynn resigned from the NSC over alleged Russian ties.  The FBI has an active investigation about Russian activity among officials of the Trump administration.  The attorney general had to recuse himself from any involvement in supervising the Russian investigation.  This story will remain a problem for the administration and absorb precious political capital, which will reduce the odds of accomplishing other goals, such as tax reform, infrastructure spending and trade policy.

The Nixon overtones are hard to quash.  Firing a figure that is conducting an investigation of one’s administration looks like a cover up.  That factor is going to be difficult to overcome.  One way to manage the story is to appoint a special prosecutor.  However, once that door is opened, it becomes impossible to control.  President Clinton’s special prosecutor started with Whitewater; it ended with Monica Lewinsky.  The key to whether a special prosecutor needs to be appointed will likely come from Senate Republicans.  If enough of them decide to press for this action, it will be hard for the president not to acquiesce.

At the same time, the situation doesn’t compare well to Nixon.  Although Trump is a political outsider, which Nixon was as well, Trump’s party controls Congress.  Nixon faced a Congress controlled by Democrats.  There were people in jail tied to the Nixon re-election campaign.  Nixon was involved in a cover up.  There isn’t clear evidence that the Trump administration has done anything wrong, although the investigation continues.

Comey was controversial.  His handling of the Clinton private server investigation was unorthodox.  He was clearly a man guided by his own internal compass, which makes him dangerous to power.  At the same time, his ability to manage investigations was questionable.  At last summer’s press conference, he laid out a case suggesting Clinton was guilty.  In our interpretation of his remarks, it seemed to be leading to an indictment but instead, in what appeared to be a surprise, he indicated that the FBI was not recommending that action.  The decision to “reopen” the investigation near the election was also controversial.  From a partisan standpoint, Republicans are not happy that Clinton wasn’t indicted; for Democrats, Comey turned the election to Trump.  Thus, he doesn’t really have a political constituency in Washington that would support him.

This process will be really difficult to handle.  By all accounts, the White House moved on this decision without much outside counsel.  Aides were caught off guard; Comey himself appeared shocked.  It almost appears the White House misinterpreted how this would be taken.  The administration may have thought that Comey’s own unpopularity would make the decision popular.  Instead, Democrats are pushing for a special prosecutor and Republican reaction has been mixed at best.  Now the White House has to appoint a new director who will come under tremendous scrutiny.  In fact, the AG usually recommends a new FBI director but Sessions cannot do so because of his Russian recusal.  All told, this situation will require a lot of attention.

The bottom line is that this problem will be a distraction.  At a minimum, it will take attention away from other priorities, such as tax reform, the ACA repeal, infrastructure spending, etc.  As these goals are pushed further into 2018, the less likely they are to be achieved.  We have consistently warned that political capital is a wasting asset.  By June 2018, it’s gone whether or not a president was able to accomplish anything.  As long as the economy avoids recession and earnings remain firm, the market fallout won’t be severe.  But, if weakness develops, one cannot expect fiscal and tax policy to ride to the rescue if the administration can’t bring this issue under control.

View the complete PDF

_____________________________________

[1] Mark Felt, a deputy director, was unhappy that he wasn’t appointed to the acting role and, as we recently discovered, was the famous “deep throat” of Watergate.

Daily Comment (May 9, 2017)

by Bill O’Grady, Kaisa Stucke, and Thomas Wash

[Posted: 9:30 AM EDT] There isn’t a lot of economic or market news this morning.  Most of the market talk is swirling around the low level of the VIX.  Our contention is that the Fed is actively trying to suppress financial stress; in doing so, the need for insurance against stress, essentially, the VIX, isn’t as necessary.  The problem that arises is that there are periods, such as the Great Financial Crisis, when investors lose faith in the Fed’s ability to contain stress.  In such periods, stress soars and, consequently, so does the VIX.

This chart shows the Chicago FRB National Financial Conditions Index, one of the many different stress indices.  It has 105 different variables, including the level of interest rates, spreads, volatility indices for various financial products, precious metals prices, etc.  A reading of zero is normal; any reading under zero suggests low financial stress.  Since the early 1990s, it appears the Fed has actively tried to prevent stress from developing.  The trouble with this policy is that it breeds complacency, encouraging investors to take on increasing risk, confident in the view that the central bank is protecting them from danger.

Part of the problem with the VIX is that it suffers from time decay.  In other words, like most insurance, each day that the insurance isn’t needed the payment for the protection is permanently lost.  Simply recognizing that the VIX is low doesn’t necessarily mean that it should be bought; if conditions remain stable, it will continue to fall.  We view the low VIX as an indication of investor complacency but would argue that, at heart, it’s really a reflection of the conduct of monetary policy.

There are three geopolitical concerns we are monitoring today.

A surge in Afghanistan?  It appears the administration is considering an increase in U.S. military involvement in Afghanistan.  Over the past couple of years, the Taliban has been steadily gaining control of the countryside.  Advisors to the president are putting together a plan to boost U.S. troop presence with the goal of forcing the Taliban to negotiate a settlement.  Currently, it appears that the level of troops is too small to be consequential but large enough to be a target.  However, it’s difficult to see how an increase of a few thousand troops will change the Taliban’s battle plan, which has always been to outlast the U.S.  In fact, this has generally been the battle plan of insurgents in Afghanistan throughout history.  Although we harbor serious doubts that escalation will work, the political danger is that much of the president’s political support came from those who supported a de-escalation of U.S. hegemony.  Escalating in Afghanistan flies in the face of that promise and could prompt a political backlash.

A new president in South Korea.  Exit polls suggest that Moon Jae-in of the Democratic Party will become South Korea’s next president.  He is replacing the disgraced Park Geun-hye, who faces corruption charges.  South Korea tends to oscillate between conservative hardliners and more liberal leaders.  Park was a conservative who conducted a hardline policy with North Korea.  Moon is expected to be more conciliatory with the Kim regime.  History shows that neither stance seems to work all that well with North Korea.  At the same time, the incoming Moon government will face a tricky diplomatic situation with the U.S.  The Trump administration has been very critical of the free trade agreement with South Korea and has threatened the South Koreans with a bill for the THAAD missile defense system the U.S. recently installed on the peninsula.  Thus, the incoming Moon government will likely enjoy a very short honeymoon.

How will Macron govern?  The new French president now faces parliamentary elections on June 11 and 18.  The goal of any French president is to have a majority of seats in the legislature so the government is unified.  However, Macron’s party is new and, at this juncture, has no seats in the legislature.  Although Macron has indicated his new party will have a candidate for every seat, it is difficult to see how he can assemble such a roster unless there are massive defections from the major parties.  So far, that hasn’t occurred.  There is still about a month before the first round of elections are held but the most likely outcome is a divided government where Macron will have to work with a prime minister who isn’t from his party.  If there is disarray in France, the parties of the extreme left and right will tend to gain power.

View the complete PDF

Weekly Geopolitical Report – Reflections on Trade: Part II (May 8, 2017)

by Bill O’Grady

In this multi-part report, we offer several reflections on trade that we hope can provide some insight into how to use macroeconomics to judge the veracity of certain claims.  In Part I, we laid out the basic macroeconomics of trade.  This week, in Part II, we will discuss the impact of exchange rates and examine the two models of economic development, the “Japan Model”[1] and the “American Model.”[2]

The Japan Model of development calls for policies that drive up household saving.  This is usually done through financial repression and wage suppression.  This model is designed to provide cheap investment funds to build up the productive capacity of the country.

In contrast, the American Model of development relies on foreign investment.  In this arrangement, the trade deficit is an import of foreign saving for investment.

As a review from Part I of our report, the following saving identity means that the private investment/savings balance (I-S) plus the public spending balance (Govt-Taxes) is equal to the trade account, M-X (Imports less Exports).

(M – X) = (I – S) + (G – Tx)

If a nation’s saving equals its investment and it runs a balanced fiscal budget, then it will run a balanced trade account.  It doesn’t matter what the exchange rate is or what trade policy is in place; if the private and public sector balances, there will also be balanced trade.

View the full report

___________________________________

[1] We call this the Japan Model because it has been adopted by Asian nations for development.

[2] We call this the American Model because it is how the U.S. acquired saving during its industrial revolution, which began in earnest in 1870.

Daily Comment (May 8, 2017)

by Bill O’Grady, Kaisa Stucke, and Thomas Wash

[Posted: 9:30 AM EDT] Emmanuel Macron won a resounding victory in Sunday’s French presidential elections, winning 66.1% to 33.9%, an even bigger landslide than polls suggested.  Le Pen did do well in the de-industrializing north and in the anti-immigrant south, but she struggled elsewhere.  To win, Le Pen needed the left-wing populists to vote for her; instead, they either voted for Macron or abstained.  In addition, as we have seen in other elections, right-wing populists are never enough of an electorate to win outright.  The candidate must also gather support from establishment right-wingers and Le Pen apparently failed to gather support from the establishment right.  Abstentions were 27% of the ballots, suggesting a rather disappointed electorate.

The next political event will be legislative elections next month.  Current polls suggest Macron’s emerging party will get 24% of the seats, with the center-right attracting 22%.  The National Front is expected to grab 21% of the seats, with the left getting 28%.  The remaining 5% tends to go to fringe parties.  It isn’t clear if Macron can form a majority with his followers and the center-right, so the lack of power in the legislature could hamper his ability to press his deregulation platform into law.

Although the major media is trumpeting Macron’s win as a triumph over populism, we doubt this election will signal the end of the movement.  It is important to remember that Jean-Marie Le Pen lost the 2002 presidential election 82.2% to 17.8% to Jacques Chirac.  So, even though Marine Le Pen was soundly beaten, her numbers improved dramatically in 15 years.  If Le Pen had been able to build a message that attracted the center-right, which is what Trump was able to accomplish, the outcome might have been much different.  On the other hand, the “Nader coalition”[1] of the populist left and right failed to materialize in France and has mostly failed everywhere.  But, that doesn’t mean it could never occur.

Market reaction to the Macron win was anti-climactic.  Given Macron’s lead in the polls, the financial markets had discounted his win by seeing European equities and the EUR rise into the vote.  Consequently, we are seeing long liquidation of positions, leading to a weaker currency and lower equities this morning.

Saudi Arabia and Russia have signaled that the current production cut agreement could be extended into 2018.  Our position is that the Saudis will take the Draghi option (“do whatever it takes”) to prop up oil prices into the Saudi Aramco IPO next year.  The primary beneficiary will be U.S. domestic oil producers who will benefit from higher prices and the ability to gain market share from these overseas producers.

China’s foreign reserves edged higher, up $20.4 bn to $3.029 trillion.  The Chinese government has been successful in cutting outflows from China, bolstering reserve numbers.  Although the trade data (see below) was a bit better than expected, it came mostly from falling imports.  Commodity imports were especially disappointing, with crude import volumes down 15.8%, petroleum products down 3.4%, copper off a whopping 25.1% and iron ore down 13.0%.  The drop in commodity imports is a major negative for commodity-producing nations as it suggests that the Chinese economy may be slowing.  There are growing worries about China’s debt load.  The FT[2] quotes a World Bank study warning that state and local government borrowing is growing despite regulatory efforts to curtail debt growth.  These government entities are using the shadow banking system to lend to special purpose vehicles to expand borrowing and skirt regulatory hurdles.

View the complete PDF

______________________________________

[1] Nader, R. (2014). Unstoppable: The Emerging Left-Right Alliance to Dismantle the Corporate State. New York, NY: Nation Books.

[2] https://www.ft.com/content/799a1afa-3135-11e7-9555-23ef563ecf9a?utm_source=The+Sinocism+China+Newsletter&utm_campaign=7796306811-EMAIL_CAMPAIGN_2017_05_08&utm_medium=email&utm_term=0_171f237867-7796306811-29661833&mc_cid=7796306811&mc_eid=e77499fecc (pay wall)

Asset Allocation Weekly (May 5, 2017)

by Asset Allocation Committee

In our most recent quarterly asset allocation meetings, our analysis determined that emerging markets would not be added to the portfolios.  Since this asset class has been this year’s best performer, some explanation is in order.  One of the primary reasons we have refrained from adding emerging markets is the dollar’s strength.

The blue line on this chart looks at the relative performance of emerging markets to the S&P 500.  When the line is rising, the S&P is outperforming emerging markets.  The red line is the JPM real dollar index.  The two series are positively correlated at 80.8%, meaning that a stronger dollar tends to reflect the S&P 500 outperforming the emerging markets.  This correlation has weakened modestly recently, but is still quite elevated.

The second reason we have been reluctant to add emerging markets is because the relative outperformance is occurring with weaker commodity prices.

Although the correlation isn’t as strong as with the dollar, rising commodity prices tends to coincide with stronger relative emerging market performance.  Although commodities are off their lows, they remain depressed. Thus, the current level of commodity prices seems to support weaker relative emerging market equities.

This chart shows a model of the emerging market/S&P 500 relative performance regressed against the JPM dollar index, the CRB index and fed funds (advanced six months).  Currently, the model is suggesting that emerging market equities are overvalued relative to the S&P against these three independent variables.

Despite this overvaluation, it is possible that the strong relative performance of emerging markets is anticipating a recovery in commodities, a slowing of monetary policy tightening or a weaker dollar.  The dollar lifted on expectations of tighter policy and if the FOMC does not raise rates as much as expected or if foreign central banks reverse their current easy policy stances, then the dollar could weaken.  However, this model suggests that emerging market equities have already discounted that outcome.  Thus, we are concerned that emerging market equities may be ahead of the fundamentals.  If this is true, the current strong performance of emerging markets could stall even with dollar weakness, rising commodities or a stall in Fed tightening.  And, if the dollar rises, commodities fall further or the FOMC raises rates according to the “dots plot,” emerging markets could be quite vulnerable.  For now, we believe the risks exceed the potential return from these levels.

View the PDF

Daily Comment (May 5, 2017)

by Bill O’Grady, Kaisa Stucke, and Thomas Wash

[Posted: 9:30 AM EDT] It’s employment day!  We cover the data in detail below.  The report was mostly strong, although wage growth continues to disappoint.

On Sunday, the French go to the polls for a runoff election between Emmanuel Macron and Marine Le Pen.  The latest polls show Macron leading 62% to 38%.  Although we don’t want to call the election prematurely, a Le Pen win would be an historic outlier.  As we noted last week, the current spread is roughly where Truman/Dewey stood about five weeks before the election.  However, at the time of the election, the spread had narrowed to about 5%.  Truman’s win was still a stunner but the polls were going his way into the election.  Le Pen has not seen any surge in support; in fact, she peaked around 41% last week and has now fallen to 38%.  Overall, she commands about 40% of the electorate and probably won’t improve beyond that.  Thus, we expect Macron to be the next president of France.

We do note that the French president isn’t all that powerful; a good way of thinking about the French system of government is that it is a combination of the American presidential system and the European parliamentary system.  The president does have great authority in foreign policy but domestic policy power really resides with the prime minister who is approved by the legislature.  Normally, the president is the leader of a major party that also controls the legislature.  Thus, the PM is usually seen as an agent of the president.  However, on occasion, the president will represent a different party than the PM, a condition called “co-habitation.”  Such governments tend to be unstable.  The president can dissolve the Assembly and trigger new elections, but this avenue probably isn’t available to Macron if he gets stuck with a legislature he doesn’t like since he has no party.  Parliamentary elections will be held next month and Macron will have a PM thrust upon him, most likely from the center-right, as he has no real party apparatus.  This condition probably means that Macron will be a weak leader and current policies in France will remain in place…and since those policies aren’t all that popular, the likelihood of a continued populist backlash is high.

Yesterday, the House did narrowly pass the AHCA bill.  Although this is being celebrated with great relish by the House leadership and the president, the Senate has already made it abundantly clear that nothing on this is going to happen quickly.  First, Senate leaders are indicating that they will write their own version of the bill and not use the House version as a starting point.  That surely means reconciliation will be almost impossible.  Second, McConnell has indicated he will wait for the CBO to score the bill.  The House moved before the bill was scored, most likely because it feared the CBO would indicate a sharp rise in the uninsured.  Although there are some political analysts suggesting that the House may be in play after this vote, it still seems like a long shot.  Using the Cook Political Report[1] analysis, the categories of “Likely” Republican and “Lean” Republican bring in 234 seats, a 16-seat majority.  Cook did shift 14 seats from Likely to Lean for Republicans after the report,[2] and three into the “Toss-Up” category, suggesting the vote does increase the risk of a turnover in the House.  However, at this juncture, it’s still a long shot for the Democrats to take control.  If the Senate bogs down the process, the potential negative impact of the vote is probably lessened.  Still, for the financial markets, the fact that something was accomplished may boost hopes that tax reform, or at least cuts, could be possible.

Oil prices have come under pressure, dipping under $45 per barrel for WTI on a few occasions overnight.  We view $45 as psychological support, so some consolidation at this level is possible.  As we have been noting for weeks (including yesterday), oil prices have been quite rich relative to oil inventories and the dollar.  Some degree of correction was likely.  On the other hand, the Saudis remain committed to propping up prices so they should be willing to cede market share to other producers, including the U.S.

This chart shows U.S. crude oil exports.  Although the U.S. banned oil exports in 1975, an exception for Canada was made to facilitate smooth refinery operations.  Note the spike in exports seen since the ban on exports was lifted in January 2016.  Rising U.S. oil production and exports pits American producers against OPEC + Russia.  It will be interesting to see how long the cartel will tolerate the loss of market share from U.S. production.

View the complete PDF

___________________________________________

[1] http://cookpolitical.com/house/charts/race-ratings

[2] http://cookpolitical.com/story/10342