by the Asset Allocation Committee | PDF
Chair Powell’s term as leader of the FOMC comes to an end in early February 2022. It appears likely, at this time, that he will be reappointed for another four-year term. Decision markets currently put the odds of another term at 85%. Given all the policy actions that are on the docket for this autumn—an infrastructure bill, the budget, and the debt ceiling—not to mention the political capital lost over Afghanistan, it seems unlikely that the administration has enough bandwidth to push a new Fed chair through Congress. The path of least resistance is to renominate Powell.
However, least resistance doesn’t mean no resistance. Left-wing populists in Congress want a different Fed chair. This group thinks Powell is too lenient on bank regulation and wants someone more committed to climate change policy. Powell has mostly conducted an accommodative monetary policy.
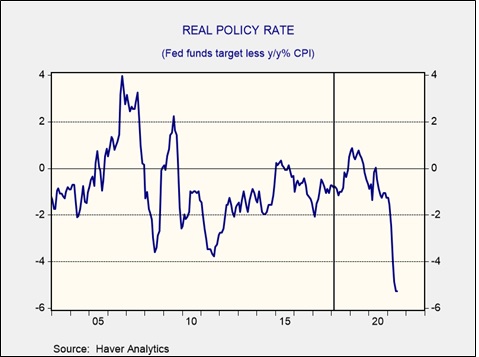
This chart shows the real fed funds rate; Powell’s term is shown by the vertical line. Although he briefly had a positive real policy rate in parts of 2018 and 2019, most of his tenure has seen negative real policy rates. And, his quick reaction to the pandemic has been widely complimented.
Opponents to Powell’s reappointment are really getting at philosophical issues surrounding the central bank. The question really is whether or not central banks should be independent. There is a longstanding difference of position on central bank independence. For those who oppose it, the argument is that the central bank should have monetary policy aligned with fiscal policy. This is what is often called the “whole of government” approach. It makes sense that policy should move in a single direction; it makes little sense for government policy to work at cross-purposes and that outcome is possible with an independent central bank. During WWII, the Fed stabilized interest rates in order to support the war effort. This is a classic whole of government policy. It would have caused problems if the Fed had raised rates to offset the effects of government spending on the war effort.
It appears to us that Powell’s opponents are really pushing for a whole of government approach. The argument seems to be that the issues of inequality and climate change are so critical that normal policy approaches are not justifiable. Instead, the Fed should conduct monetary policy to support government efforts to transform the economy away from fossil fuels and to reduce inequality. Therefore, fiscal spending to reduce the impact of climate change should be accommodated by expanding the balance sheet to provide affordable funding.
Those who argue for central bank independence point out that money is critical to the proper functioning of society. There are essentially two ways that societies have tried to enforce monetary stability. The first is through linking money creation to a commodity, often gold. The idea is that users will have more faith in the store of value function of money if the control of the supply is given to an entity outside of government. Since gold is created through mining, the supply of money is independent of government actions.
The second way that societies have created stable money is through central bank independence. The idea is that if the central bank’s primary job is defending the value of the currency (which ultimately is about stabilizing inflation), and if it can act independently of fiscal policy, then stable money can be created. For the most part, most nations have stopped using a metal standard for money; in practice, metallic standard money was too inflexible. During periods of industrialization, when the supply of goods rose, the supply of gold might not expand fast enough to prevent deflation. History shows that consumers and firms tend to act asymmetrically to deflation compared to inflation. Deflation tends to depress consumption and investment because there is less incentive to spend as prices are declining; the longer one waits to buy, the better the price. So, governments have concluded that moderate inflation is the best outcome for society. Since the 1980s, there has been a consensus that central bank independence coupled with a clear inflation target was the best way to stabilize money.
Policy differences have tended to be constrained within the framework of central bank independence. There have been debates between “hawks” and “doves” about how policy should be implemented. In general, the hawks lean toward maintaining a low inflation target and moving preemptively to ensure the target isn’t violated, whereas doves tend to be more forgiving on violating the inflation target to support economic growth. Recent actions, led by Chair Powell, to make the inflation target less stringent suggest he leans dovish on policy.
In general, the argument for the whole of government approach is that it makes little sense for government policy to work at cross-purposes. If the economy needs stimulus, why should fiscal policy be eased while monetary policy is tightened? The downside of this approach, as history indicates, is that every government believes its goals are sacrosanct and wants no constraints; this situation will tend to lead to higher inflation. The monetary stability approach, in contrast, suggests that money is too important to be left solely in the hands of the political class. Left to their own devices, the political class will tend to put less emphasis on monetary stability. Thus, either a metallic standard or central bank independence is necessary. Critics of this approach argue that policy can be overly constraining.
What the left-wing populists are proposing isn’t simply a dovish policy but a wholesale change in the conduct of monetary policy. Selecting a different Fed chair probably won’t accomplish that outcome; the Federal Reserve-Treasury Accord of 1951 established the Fed’s independence. It would likely take a broader act of Congress to accomplish what the left-wing populists want.
For investors, this debate is critically important. Although Chair Powell will likely be renominated, the push for a whole of government approach is something that bears watching. Modern Monetary Theory assumes a non-independent central bank and that theory has been in ascendency. A move away from central bank independence increases the odds of higher inflation and less constraint on government policy. Although the Fed remains independent, that policy isn’t scriptural; it comes from Congress and can be removed by that same body.
View PDF