Asset Allocation Weekly (July 30, 2021)

by the Asset Allocation Committee | PDF

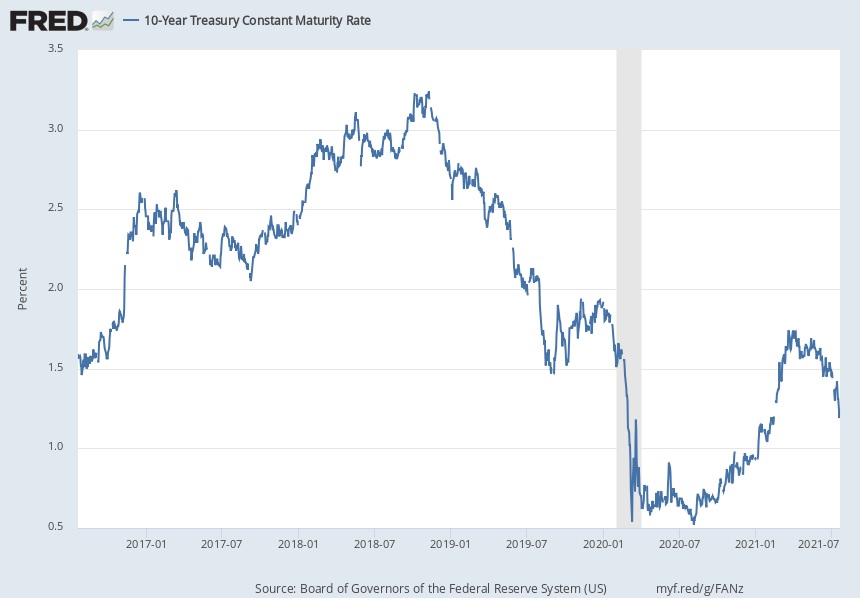
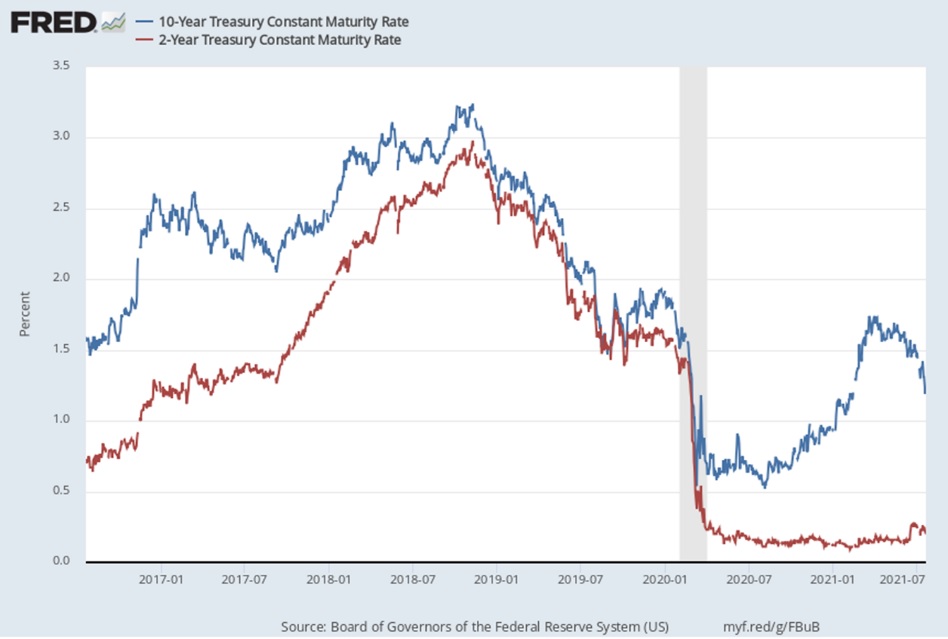
One of the key developments in financial markets recently has been the quick rebound in bond prices and the associated drop in yields.  As investors started to sense faster economic growth and the prospect of rising inflation in the first quarter, they eagerly sold down their bond holdings, driving yields higher.  The yield on the benchmark 10-year Treasury note jumped from 0.92% at the end of 2020 to an intraday high of more than 1.75% in late March (see following chart).  Since then, however, bond buying has gradually strengthened again, and yields trended downward throughout the second quarter.  Even when the Federal Reserve surprised markets in mid-June by hinting that the next interest rate hike might come by 2023, the resulting bond sell-off and yield jump was quickly reversed.  In July, investors began buying bonds and driving down yields even faster, with the 10-year Treasury yield falling below 1.13% on July 19.  This report looks at why yields are falling again and whether the downtrend is likely to continue.

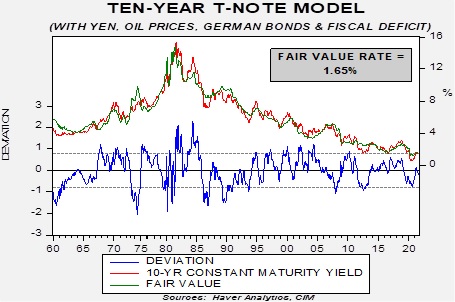
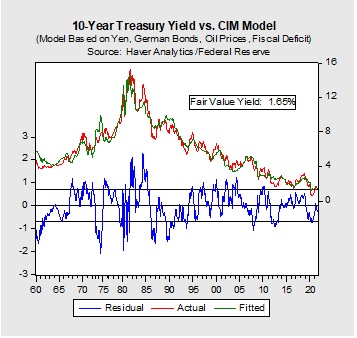
It’s one thing to know where yields have been; it’s quite another thing to understand where they should be and where they may be going.  To get at that issue, our bond model estimates where the 10-year Treasury yield should be based on several variables.  The most important variables are the Fed’s “fed funds” interest rate and, as a proxy for inflation expectations, the 15-year average of the yearly change in the consumer price index (CPI).  Other variables in our model include the yen/dollar exchange rate, oil prices, German Bund yields, and the U.S. fiscal deficit scaled to gross domestic product (GDP).  As shown in the chart below, the jump on bond yields early this year merely brought the 10-year Treasury yield up to the fair value estimated by our model.  With the recent rebound in bond prices, yields have again fallen below their fair value, which the model currently puts at 1.65%.

In other words, bonds once again look expensive―not as expensive as at the beginning of 2021, but enough to suggest bond investors see reason for caution regarding monetary policy and economic prospects.  Many investors think the Fed will eventually tighten monetary policy just enough to smoothly bring down today’s high inflation rate.  A less benign view among other investors is that the Fed might tighten policy too soon or too quickly.  Those investors are worried about a policy mistake that could trip up the economic recovery and produce another recession.  Still other investors think longstanding structural factors such as globalization and population aging will eventually reassert themselves and push down growth and inflation to the levels seen before the coronavirus pandemic.  Such an environment of rising interest rates in the near term coupled with an eventual moderation in rates is consistent with the recent flattening in the yield curve.  For example, the chart below shows how the yield curve, represented by the difference between the 10-year and the two-year Treasury rates, has changed recently.

In any case, we think our model’s call for higher interest rates should be respected, especially given the risk that inflation could stay high for longer than anticipated and gradually push up longer-term inflation expectations.  We note that the 15-year average of CPI inflation that serves as a proxy for inflation expectations in our model is just under 1.90%.  Other measures of inflation expectations, such as consumer surveys and the difference between nominal and inflation-protected bond yields, point to even higher future inflation.  Even if the 10-year Treasury yield rebounds in the near term, we still believe it probably wouldn’t go much past 2.00%, but the risk of rising yields (and falling bond prices) has prompted us to reduce our exposure to longer-term bonds in several of our strategies for the third quarter.

View PDF

Business Cycle Report (July 29, 2021)

by Thomas Wash | PDF

The business cycle has a major impact on financial markets; recessions usually accompany bear markets in equities.  The intention of this report is to keep our readers apprised of the potential for recession, updated on a monthly basis.  Although it isn’t the final word on our views about recession, it is part of our process in signaling the potential for a downturn.

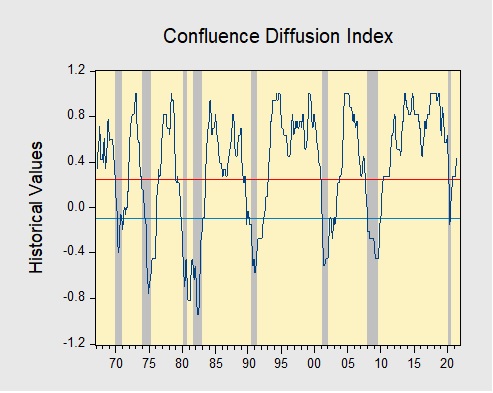
In June, the diffusion index rose further above the recession indicator, signaling that the recovery continues. In the financial markets, a sharp rise in inflation expectations led to a modest sell-off in equities in the middle of the month. Meanwhile, construction and manufacturing activity slowed as increasing costs for materials are becoming a problem for homebuilders and factories. Lastly, the labor market remains strong as payrolls rose at the fastest pace in 10 months. As a result, eight out of the 11 indicators are in expansion territory. The diffusion index rose from +0.3939 to +0.4545, above the recession signal of +0.2500.

The chart above shows the Confluence Diffusion Index. It uses a three-month moving average of 11 leading indicators to track the state of the business cycle. The red line signals when the business cycle is headed toward a contraction, while the blue line signals when the business cycle is headed toward a recovery. On average, the diffusion index is currently providing about six months of lead time for a contraction and five months of lead time for a recovery. Continue reading for a more in-depth understanding of how the indicators are performing and refer to our Glossary of Charts at the back of this report for a description of each chart and what it measures. A chart title listed in red indicates that indicator is signaling recession.

Read the full report

Weekly Geopolitical Report – The Protests in Cuba (July 26, 2021)

by Bill O’Grady | PDF

Over the past two weeks, Cuba has been racked with widespread protests.  As this map suggests, the civil unrest was scattered across the island nation.

(Source: Geopolitical Futures; used with permission)

The widespread nature of the protests suggests some degree of coordination (and, it appears there was).  Two groups, the San Isidro Movement and the 27N Movement, used social media to organize marches and protests.  At the same time, the size of the protests also suggests widespread dissatisfaction with the regime.  Even the elderly turned out.  The regime blamed outside forces (read: U.S.), but this uprising seems to be a home-grown response to a deteriorating economy.

The government’s response was typical.  It arrested hundreds, shut down the internet on July 11, and promised to do better.  After switching the internet back on a few days later, the world got a peek at the repression of the Cuban security forces.

Cuba has geopolitical significance.[1]  For the U.S., the risk of a foreign power controlling Cuba means that trade could be stifled at the Port of New Orleans, which is where the agricultural and industrial abundance of the Mississippi River system finds its way to the world.  In addition, it could bottle up the Port of Houston which is critical for the American oil industry. Thus, the U.S. has been interested in Cuba since the Louisiana Purchase.

In this report, we will begin by discussing the underlying structural problems of the Cuban political system and its economy.  Next, we will examine the specific factors that have negatively affected the Cuban economy and created conditions that have led to the current unrest.  We will close with the U.S. response to the protests and market ramifications.

Read the full report


[1] For a review of Cuban geopolitics and history, see our WGR from 1/5/2015, “The Cuban Thaw.”

Keller Quarterly (July 2021)

Letter to Investors | PDF

Judging by the questions we’ve received in the last couple of months, the stock and bond markets have confused many.  This is OK.  Trying to explain why the markets have recently done something is an impossible task.  In a former life I was regularly asked by business reporters why the stock market had done “thus-and-such” on a given day.  I was sympathetic to their plight: they had to write something for their newspaper’s morning edition, even if there really wasn’t a good explanation for the market’s movement.  The problem is that, often, the market doesn’t move on a real change in conditions, but on what market participants think the next round of changes might be.  And that thinking may be wrong.

Investors often believe that when they delve into the stock market they are participating in a sort of beauty contest, by which they are judging which contestant (stock) is the most beautiful.  But they are really participating in a derivative of a beauty contest: they are making a judgment about which contestant others will believe is most beautiful.  And others may be wrong!  This phenomenon is what led Warren Buffett to once say: “In the short run the stock market is a voting machine, but in the long run it is a weighing machine.”  How true! In the short run, the investment market is a sort of popularity contest, but in the long run a truly good investment will stand out from all the rest.

Last month, the stock and bond markets reversed course because of changes the members of the Federal Open Market Committee (FOMC) made in their forecasts of interest rates, as displayed quarterly in their so-called “dots chart.”  Many investors thought these forecasts meant that the Fed would begin raising interest rates in late 2022, about a year earlier than expected. These investors immediately jumped to the conclusion that the Fed would tighten too soon, sending the economy into a premature recession, leading these investors to sell stocks and buy Treasury bonds.  All this occurred without the Fed actually raising rates, or even setting a date to raise rates.  It was all due to guesswork by investors as to what may happen a year-plus down the road, guesswork that may change.  (Indeed, it seems to have already changed.)

This behavior is nothing new, in fact, we have observed it in markets for centuries.  The near impossibility of correctly guessing what the “crowd” will do next is why trading strategies rarely work.  We’ve always thought it better to get on the “weighing machine” side of the market, that is, to focus on investments that have the sort of positive characteristics that are recognized over the long term.

In the near term, our decision-making is guided by our conviction that the U.S. and developed world economies are in recovery mode from last year’s pandemic-induced recession.  This is a good place for investors to be: companies are seeing a return to business that helps their earnings, dividends, and credit ratings, which is good for both their stocks and bonds.  While there are many other things affecting the markets, all these are of lesser importance, in our opinion, than this key trend.

The factor most likely to imperil this economic and market trend is, in my opinion, a resurgence of the pandemic to levels we saw a year ago.  We watch pandemic developments closely, as readers of our Daily Comment are aware.  While the delta variant of COVID is surging worldwide, it appears to be less lethal than the original version.  With almost half the population vaccinated in most developed economies and with the mRNA vaccines proving to be very effective against this variant, we believe it is unlikely that economic progress will reverse.  Not only that, but the medical community has learned so much about how to treat those infected that we don’t expect this variant to be anywhere near the disruptive force the original version was.  Thus, even regarding COVID, we believe the long-term weighing machine of the markets should work in investors’ favor.

We appreciate your confidence in us.


Gratefully,

Mark A. Keller, CFA
CEO and Chief Investment Officer

View PDF

Asset Allocation Weekly (July 23, 2021)

by the Asset Allocation Committee | PDF

The availability of ample investment capital is vital for economic growth in both rich, well-developed countries and poorer developing nations.  However, if the available capital is poorly utilized and/or debt levels get too high, the results can be quite negative.  In such a situation, economic growth can slow as companies and individuals struggle to make their debt payments.  Economic shocks can cause companies, individuals, or governments to miss their payments and go bankrupt, potentially sparking a financial crisis and damaging the country’s financial system.  High debt levels in China have been especially concerning for years, so it may be useful to review the latest data on that country from the Bank for International Settlements.

As shown in the following chart, the stronger, richer, advanced countries can typically tolerate a higher level of debt (per BIS practice, we focus on total credit to the nonfinancial sector).  For the average advanced country in the BIS database, total credit to the nonfinancial sector stood at 321.3% of gross domestic product (GDP) at the end of 2020.  For the average emerging market, credit to the nonfinancial sector stood at just 240.1% of GDP.  Note, however, that China stands out with its debt burden of 289.5%, which is significantly higher than the emerging market average and far above the burdens for other large developing countries like Brazil, India, and Mexico.

The BIS figures are broken down into the amount of credit provided to the nonfinancial corporate sector, the household sector, and the government sector.  At this level of detail, we can see that China’s high overall debt burden stems mostly from its nonfinancial corporate sector.  In China, nonfinancial corporate debt alone stands at 160.7% of GDP compared with 119.4% of GDP in the average emerging market.  Moreover, China’s high corporate debt relative to the rest of the emerging markets has persisted for years.  Often, China’s corporate debt burden by this measure is almost half again as high as for the average emerging market.  China’s nonfinancial corporate debt burden is even higher compared with the 104.4% of GDP in the average advanced country.  Indeed, nonfinancial corporate debt to GDP in China is even higher than in high-debt Japan, and it is almost as high as in Belgium.

This high reliance on corporate debt marks a new strategy for China.  During the Global Financial Crisis of 2008-2009, Beijing relied primarily on government fiscal spending and public borrowing to support the economy, but that left many government entities burdened with debt for years afterward.  In contrast, Beijing’s approach to supporting the economy during the 2020 coronavirus pandemic was to channel funds through the business sector to keep workers in their jobs and maintain production to the extent possible.  The resulting boost to debt in the corporate sector was even bigger than the increase in debt within the government sector, as shown in the chart below.

Because of the boost in credit to the corporate sector last year, Chinese companies may now be hobbled by their high debt levels, especially if interest rates rise or the worsening U.S.-China geopolitical rivalry further crimps Chinese trade flows.  This is one reason why we have taken steps to limit our exposure to China in our asset allocation strategies.  In our view, China’s combination of high corporate debt levels and increased regulatory risks related to potential capital flow restrictions should argue for below-benchmark weightings to the country.

View PDF

Asset Allocation Quarterly (Third Quarter 2021)

by the Asset Allocation Committee | PDF

  • There is no recession within our forecast period. Monetary and fiscal stimulus should continue in the U.S. over our three-year forecast period, yet at a decreasing rate as the economy recovers.
  • After a surge in inflation this year and into next year, resulting from the economic recovery following the pandemic, inflation should settle within the Fed’s threshold.
  • The ECB remains aggressively accommodative and is supported by the EU’s fiscal stimulus, which should help to hasten the pace of their economic recovery.
  • Equity allocations among all strategies remain elevated with the retention of a heavy tilt toward value and, where risk appropriate, an overweight to small capitalization stocks.
  • The high allocation to international stocks remains intact given our expectations of overseas growth.
  • In the more risk-tolerant strategies where emerging market exposure is employed, mainland Chinese stocks are either vastly underweighted or excluded.
  • Commodity exposure is retained with heavier concentration in the more risk-averse strategies for the advantages they afford during heightened geopolitical risk.

ECONOMIC VIEWPOINTS

Although the boundless fiscal and monetary spigots are unlikely to remain open indefinitely, we find there is ample liquidity and activity to propel the economic recovery through our three-year forecast period, albeit in fits and starts. Though we note that the prospect for a shortened business cycle exists, this is not our base case. Rather, we expect real GDP growth over the next three years, yet certainly at a less robust pace than we have experienced thus far this year.

The latest meeting of the Fed registered growing concerns about persistently dovish policy. Where Fed members stated earlier in the year that they were “not even thinking about thinking about raising rates,” one of the ‘thinkings’ in the quote is now absent. The rise in core CPI that occurred in June, representing the largest monthly year-on-year increase in 30 years, has weighed upon the resolve of several Fed bank presidents. Nonetheless, though some have waivered on the prospect of being excessively accommodative for an extended period, we expect that the price increases measured against last year’s COVID-induced low base level and further pressure from rolling supply constraints will not prove durable. The higher probability is that current price increases will endure to varying degrees depending on products, but persistent increases beyond these supply adjustments are less likely. We expect that the Fed Chair and the composition of voting members will retain a dovish overall stance, despite some near-term cautionary flags being waved. The least likely Fed action is a decrease in the size of its balance sheet while simultaneously implementing a series of increases in the fed funds rate, as performed in 2018 and 2019. More likely is a decrease in the aggressive $120 billion monthly balance sheet purchases of Treasuries and mortgages. While this will probably lead to volatility in bonds and equities over a short period, similar to the “Taper Tantrum” of eight years ago, we expect prices to adapt relatively quickly.

In contrast with some Fed bank presidents expressing caution regarding future inflation, the European Central Bank [ECB] has pivoted significantly from its former position of combating inflation. Where it was previously unimaginable for the ECB to accept inflation above 2%, it is now willing to allow prices to run in excess of its ceiling. President Lagarde disclosed the ECB’s new policy framework of “symmetric 2% over the medium term” and the bank is expected to refresh its guidance on both policy rates and QE program. In addition, the sequential issuance of NextGenerationEU bonds as part of the COVID relief package will provide fiscal stimulus for the continent and support the euro as a reserve currency. Finally, the EU’s €1.1 trillion multi-year budget through 2027 has designated nearly half for modernization, adding further fiscal stimulus.

Beyond the U.S. and the EU, monetary and fiscal stimulus is rampant in developed nations as well as most emerging market economies as they attempt to recover from pandemic-induced recessions. Consequently, the world remains awash in liquidity. While this can lead to distortions in some asset prices and misallocations of capital, the liquidity will allow firms to remain viable during the recovery. The overriding issue, therefore, is whether the eventual reduction in the uber-accommodative postures will lead to a stunting of the business cycle or allow the global economy to enter an expansion. While we expect the latter to prevail, we note the potential for the former is greater than zero yet less likely within our three-year forecast period.

STOCK MARKET OUTLOOK

Exposure to equities remains intact as fiscal and monetary policies along with measures of sentiment all support continued economic recovery. Though our expectations have been tempered, our outlook remains positive despite near-term issues. One of the most cited issues is the supply shocks in different segments of the economy, whether semiconductors, building supplies, transportation, or used cars, among other items. The pre-pandemic trend of building redundant supply chains has accelerated and encouraged inventory accumulation, creating bottlenecks in supply and leading to rapid price pressures. The June CPI print of +4.5% year-over-year ex-food and energy underscores the price pressures from supply constraints as inventories are increased. As the chart shows, and economic logic dictates, building inventories historically leads to higher prices. The pandemic has magnified this effect to unprecedented levels, resulting in price increases, which we project could continue into early next year. However, as the uneven emergence from the pandemic unfurls and consumer appetites become satiated, price increases for certain goods could hold at higher levels but we don’t believe they’ll continue their ascent. Thus, we do not expect persistent rapid inflation.

Although the threat of inflation sends shivers through the equity markets, the economic recovery and potential move into expansionary territory bodes well for stocks. While inflation can negatively affect stocks in general, as future earnings are discounted at higher rates and P/Es compress, it affects companies, industries, and sectors disproportionately. Cyclical companies have historically held pricing power during periods of inflation, assuring continued profitability. Further, smaller entities are able to nimbly adjust to changes in supply chains and prices. Our original tilt to value versus growth, overweights to Industrials and Materials in U.S. large cap stocks, and lean toward lower capitalization companies were applied due to expectations of an economic recovery, but issues with near-term inflation don’t invalidate this premise. Rather, it underscores the benefits of this positioning as well as the overweights to Financials initiated in January and homebuilders in October 2020.

International developed markets are facing similar supply issues as the U.S., yet the ECB is more inclined than the Fed to allow inflation to run ahead of its target. We still consider the EU and U.K. to be lagging the U.S. economy by as much as half a year as they continue to struggle to emerge from the pandemic. Other developed nations (Australia, New Zealand, Canada, Japan) are also lagging the U.S. in their respective economies, and their central banks, with the exception of New Zealand, remain ultra-accommodative. The strategies’ exposure to developed markets remains elevated and has an inherent overweight to the Materials, Industrials, and Financials sectors along with a decided tilt toward value, which mirrors the overweights in the U.S. portion. Regarding emerging markets, relative valuations are still attractive, encouraging the retention of a sizable weight to this asset class in the more risk-tolerant strategies. However, concerns surrounding Chinese equities are mounting as belligerence between U.S. and Chinese authorities continues. Since Chinese stocks account for upwards of 40% of the more popular emerging market indices, we find it more prudent to employ an ETF that excludes mainland Chinese stocks.

BOND MARKET OUTLOOK

At the end of last quarter, the bond market rallied on the heels of concerns voiced by several Fed members on their expectations of combatting future inflation. The yield on the long end of the Treasury curve compressed from 2.34% in April to 2.06% by quarter’s end. The curve flattened but remained positively sloped. In addition, the spread on corporate bonds continued to narrow, reflecting investor willingness to accept credit risk. As noted in our Stock Market Outlook, though equity investors have become wary of inflation, the bond market has generally sloughed these concerns. Although we maintain the view that high levels of reported inflation will only last through this year, our outlook for bonds over the forecast period cannot be construed as being particularly sanguine. Not only has the utility of long bonds been eroded due to the rally, but the potential pressure on yields accruing from economic growth moving from a recovery into potential expansion yokes our total return expectations for bonds, especially beyond the seven-year maturity range. Accordingly, the strategies with income as a component have reigned in duration dramatically this quarter and carry heavier weightings to Treasuries and agency mortgage-backed securities [MBS]. While MBS carry both extension risk and also risk if the Fed unwinds some of its MBS positioning on its balance sheet, we view these as being compensated by the spreads widening close to historic levels.

OTHER MARKETS

Since S&P separated REITs into its own GICS sector in 2016, the complexion of REITs has become more varied. Retail, office, and hospitality now only account for roughly one-fifth of the market, while warehouses, data centers, and cell towers represent the majority. We view these latter segments as being fully valued and the traditional segments priced for recovery, thus our consensus expectation over the forecast period is for REITs to earn their dividend with little to no capital appreciation. As a result, REITs are employed solely in the Income strategy for the varied source of income they provide. Similarly, speculative grade bonds appear fully valued given their continued compression of option-adjusted spreads over the past year. Consequently, total return expectations for spec bonds are muted and they are used only in the Income strategy.

Expectations for continued global recovery lead to the retention of a broad basket of commodities containing a majority weight to energy components as well as industrial metals. In the more risk-averse strategies, this position is used in conjunction with exposure to gold, which we find attractive as the prospect for geopolitical risk remains elevated. In the more risk-seeking strategies, we added a position in silver for its industrial uses during a global economic recovery.

Read the full report

Weekly Geopolitical Report – Nigeria’s Conflict with Biafra and Social Media (July 19, 2021)

by Thomas Wash | PDF

On June 2, Twitter (TWTR, $61.72) removed a tweet posted by Nigerian President Muhammadu Buhari that vaguely threatened Biafran separatists. Buhari’s tweet appeared to be in response to a series of attacks against Nigerian security forces and police officers. In any case, Buhari has become the latest high-level political leader to have his tweet removed by Twitter. The move comes just months after former U.S. President Donald Trump was permanently banned from the platform. In this article, we explore Nigeria’s current problems in Biafra and the government’s response. We also show how the situation reflects the growing friction between social media companies and governments all over the world.  We end with a discussion of the ramifications for investors.

Read the full report

Daily Comment (July 16, 2021)

by Bill O’Grady, Thomas Wash, and Patrick Fearon-Hernandez, CFA

[Posted: 9:30 AM EDT] | PDF

Good morning, all! U.S. equities appear to be headed for a higher open this morning. The overnight news was rather quiet. Our report begins with international news and discussions about rising tensions between Poland and the EU, Iranian hackers targeting workers in the defense industry, and the flood in western Europe. U.S. economics and policy news are up next, including an update on the protests in Cuba and the infrastructure bill. China news follows, and we end with our pandemic coverage.

International news:  Flood in western Europe, defense workers being targeted by Iranian hackers, and rising tensions between the EU and Poland.

  • African nations are planning to lower intercontinental tariffs and are looking to raise $8 billion to offset the loss of tariff revenue. The decision is designed to make intra-trade within Africa relatively easier.
  • On Thursday, a flood in Germany and Belgium caused by record rainfall across western Europe led to 100 confirmed deaths and more than 1,000 people feared missing.
  • A secretive Israeli spyware company, Candiru, sold its software exclusively to governments. The software makes it easy for states to hack into iPhones, Androids, Macs, PCs, and cloud accounts. It has been used by governments to monitor and track dissidents.
  • Poland and the European Union continued their six-year feud over the rule of law. On Thursday, the European Court of Justice ruled that Poland’s system of overseeing and disciplining judges is not compatible with EU law. In response, Poland has argued that the ruling goes against the Polish constitution. If Poland persists with its oversight system, the commission could ask the court to impose daily fines.
  • Russia banned an investigative website that published a report suggesting that President Vladimir Putin secretly fathered a child outside of his marriage. The publisher of the report, Proekt Media, is based in the U.S.; however, anyone associated with the site potentially faces a prison sentence.
  • Facebook (FB, $344.46) announced that it removed several accounts connected to a group of Iranian hackers that targeted employees of defense and aerospace industries in the U.S. and Europe.
  • The European Central Bank is expected to maintain its policy accommodation for the foreseeable future, according to a Bloomberg survey of economists.

 Economics and policy: U.S. issues warning about business in Hong Kong, a U.S. tech firm is in talks to purchase its own foundry, and the Biden administration is exploring ways to restore the internet in Cuba.

 China: Beijing gives exemption for firms listing in Hong Kong, China is growing uneasy about U.S. troop withdrawal from Afghanistan, and pork prices fall in China.

COVID-19:  The number of reported cases is 189,024,605 with 4,068,772 fatalities.  In the U.S., there are 33,977,713 confirmed cases with 608,406 deaths.  For illustration purposes, the FT has created an interactive chart that allows one to compare cases across nations using similar scaling metrics.  The FT has also issued an economic tracker that looks across countries with high-frequency data on various factors.  The CDC reports that 388,738,495 doses of the vaccine have been distributed with 336,054,953 doses injected.  The number receiving at least one dose is 185,135,757, while the number of second doses, which would grant the highest level of immunity, is 160,408,538.  The FT has a page on global vaccine distribution.

 View PDF