by the Asset Allocation Committee | PDF
In May, respondents to the University of Michigan’s monthly Consumer Sentiment Survey said they expect consumer prices to rise at an average rate of 4.6% per year over the next half-decade—the highest level of inflation expectations in 12 years. In this report, we discuss why inflation expectations are rising, what the rise might mean for future inflation, and the impact it may be having on financial markets.
Inflation expectations are the proverbial boogie man of economics. Rising inflation expectations can put upward pressure on interest rates and prices, and they can cause consumer confidence to plummet. In the 1970s, rising inflation expectations became a self-fulfilling prophecy. Fearing higher prices, consumers would stock up on goods, which led to persistent inventory shortages. The lack of inventory induced firms to raise prices. The rise in prices increased the cost of living, which encouraged workers to demand more pay. This increase in pay would then be used to stock up on goods, thereby restarting the cycle. This phenomenon is often referred to as the wage-price spiral.
To bring down inflation and inflation expectations, Federal Reserve Chair Paul Volcker set short-term rates so high that they caused a double-dip recession in 1980 and 1981. Although Volcker was successful, the memory of what it took to control inflation expectations remains forever ingrained in the minds of those who had to live through the process. Keeping inflation expectations anchored is therefore considered critical to the Federal Reserve’s mandate of maintaining inflation at around 2% annually.
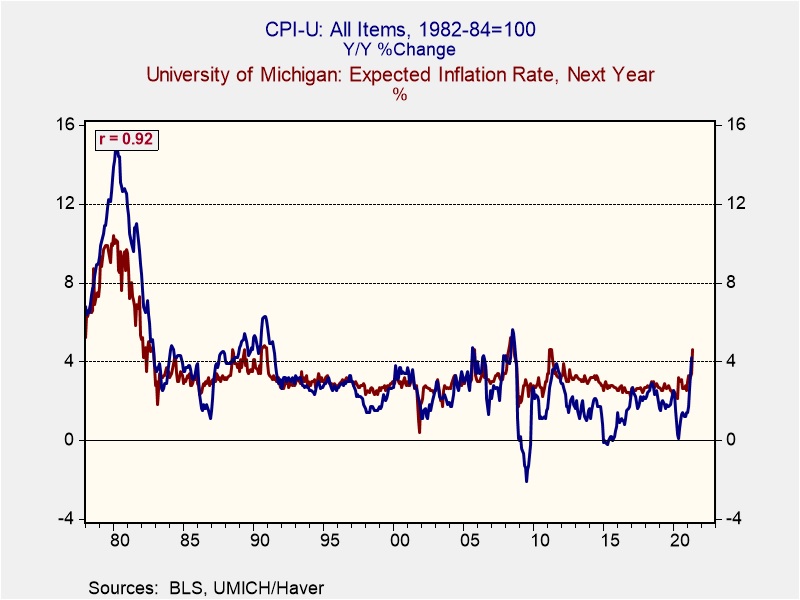
One reason for optimism regarding inflation expectations today is that they have historically fluctuated in line with the Consumer Price Index (CPI), as shown in the chart below. Inflation expectations can act more like a gauge of consumers’ present experience of inflation than a predictor of future inflation. In April, the two most important U.S. inflation gauges were both showing price increases well above the Fed’s target and far in excess of the average experience in recent years. The CPI was up 4.2% year-over-year, and the price index for personal consumption expenditures was up 3.6%. However, this high level of inflation is largely related to the recovery in prices from their early-pandemic lows one year ago. It can also be attributed to several other factors, such as pent up consumer demand, supply chain disruptions, and unprecedented fiscal stimulus. Importantly, all these factors are likely to be transitory, so today’s inflation and inflation expectations will probably moderate over time.
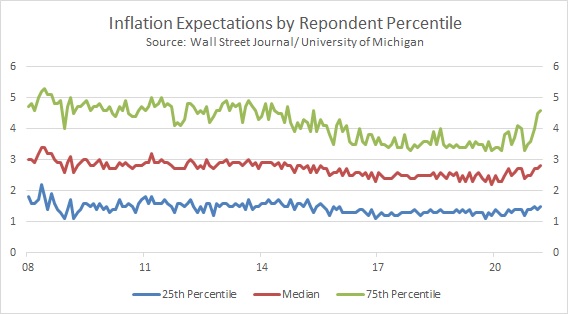
Furthermore, over the last 10 years, inflation expectations have routinely overshot actual realized inflation, sometimes by more than 2%. This upward bias may be due to a few survey respondents having a disproportionate impact on the overall report. In the latest surveys, for example, inflation expectations surged among those in the 75th percentile (i.e., the 25% of respondents with the highest expectations). As shown in the chart below, expectations rose more modestly among those in the 50th and 25th percentiles, suggesting that realized inflation in the next few years may not be as bad as some consumers fear.
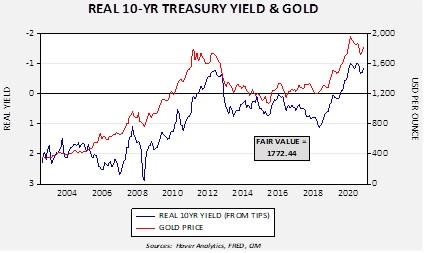
That being said, high inflation expectations have shown up in the financial markets. The yield spread between the nominal five-year Treasury note and the five-year Treasury inflation-protected security (TIPS), also referred to as the five-year breakeven rate, has widened to a 16-year high. Although the spread has eased over the last few days, it does show that investors have begun pricing in higher inflation. Of course, economic theory would suggest that unanchored inflation expectations should result in rising yields of longer-duration bonds. However, this time around, yields are likely to be capped by factors such as the high level of household saving. This large holding of savings has also pushed down the velocity of money, thus reducing inflationary pressure on the economy. As a result, we suspect the rise in the breakeven rate may be an overreaction to recent reports and would caution against hastily jumping to conclusions regarding inflation. Although inflation expectations are a concern, it is important to note that these expectations need to be sustained over a long period of time before they translate into actual inflation.
View PDF