

Author: Rebekah Stovall
Asset Allocation Weekly (May 21, 2021)
by the Asset Allocation Committee | PDF
In March, job openings rose to their highest level on record. According to the Job Openings and Labor Turnover Survey (JOLTS), there were over 8.1 million job vacancies, surpassing the previous record of 7.6 million set in November 2018. The surge in vacancies is supported by data from Indeed showing that job postings in the last week of March were 15.7% above their pre-pandemic levels and were 24.2% higher in the following month.
In contrast to the JOLTS report, the most recent employment report from the Bureau of Labor Statistics showed a general slowdown in hiring. Non-farm payroll growth in April came in at a seasonally adjusted 266,000, well below the previous month’s increase of 770,000 and far short of the expected increase of 1,000,000. The gap between job openings and new hires has created angst amongst investors and policymakers alike. There are growing fears that the gap between openings and new hires may reflect flawed policy incentives, such as overly generous employment benefits or a lack of childcare. However, our research suggests that the underlying cause of the gap may be due to people weighing options outside of employment.
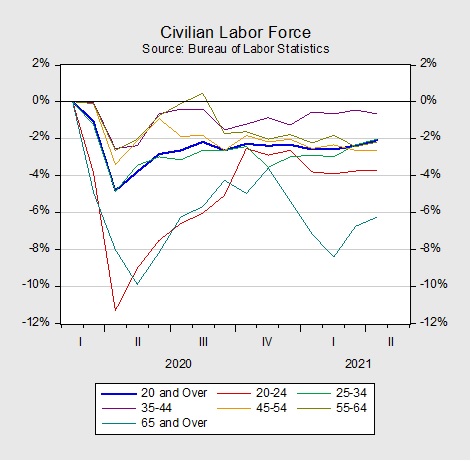
The chart above shows the percentage change in the labor force since February 2020. The civilian labor force, which includes workers that are either employed or looking for work, is 2% below the pre-pandemic levels for all persons 20 years and older. The 35- to 44-year-old age group has been the most eager to return to the labor force and is approaching pre-pandemic levels, while the youngest (20-24 years old) and oldest (65 years and older) cohorts have been the biggest drags on the labor force.
The reluctance of older and younger workers to rejoin the labor force may be due to these groups having relatively more alternatives to employment. Workers between the ages of 20 to 24 years have the option of going back to school, while the older generation has the ability to enter retirement. Data suggest there may be some truth to this claim. Although enrollment for bachelor’s degrees in 2020 dropped 2.2% from the prior year, graduate and doctoral degrees have actually increased 5.2% and 3.6%, respectively. Moreover, during the height of the pandemic, there was a surge in the number of people 65 years and older who applied for Social Security benefits. Although this trend has cooled in recent months, the number of baby boomers retiring more than doubled from 1.5 million in 2019 to 3.2 million in 2020.
An increase in labor’s negotiating power may have also contributed to people weighing their options before returning to the labor force. Eager to hit the ground running as the economy begins to reopen, firms have begun reducing their educational requirements for certain positions in order to attract more applicants. As a result, there has been a surge in job postings requiring less than a bachelor’s degree. Additionally, the recent pay increases at major companies such as Amazon (AMZN, $3,174.74), Walmart (WMT, $137.92), and Target (TGT, $209.29) may have encouraged workers to hold out for higher-paying jobs. According to research from Tracktherecovery.org, high-wage and medium-wage employment have either surpassed or are approaching pre-pandemic levels, while low-wage employment is down nearly 30%. This suggests that low-wage earners may want to bide their time before returning to the labor force.
Adverse incentives may be another contributing factor to the labor shortage. The lack of childcare may have made it difficult for single and married workers with children to search for new work, while single people with no children may find the generous unemployment benefits a more attractive option than taking an actual job. This may explain why the labor force for married people with no children has almost returned to pre-pandemic levels. If we are correct, the decision by some states to remove the pandemic booster to unemployment benefits could lift employment. Nevertheless, it may not stop the youngest and oldest cohorts from considering going back to school or entering retirement.
In short, getting back to work may be an attractive option to those who have limited alternatives to employment, have high earning power, or aren’t burdened by childcare costs. For others, the decision to return to the labor market may be more complicated. The prospect of early retirement or continuing one’s education could be more attractive than accepting a job offer. The decision is further complicated by some competing firms offering higher wages. Finally, the lack of childcare and generous unemployment benefits could also be complicating factors. However, all things considered, the labor force shortage will likely work itself out over time. Although older workers may enter or remain in retirement, the younger workers will likely come back to the labor force with more skills. In the meantime, we expect that the labor force shortage could have a mixed yet mild impact on the economy. The longer people stay out of the workforce, the more they must rely on savings to fund day-to-day activities, which cannot be maintained forever.
Weekly Geopolitical Report – The Geopolitics of Taiwan: Part III (May 17, 2021)
by Bill O’Grady | PDF
In Part I of this report, we covered the history of Taiwan along with current relations between the People’s Republic of China (PRC) and the Republic of China (ROC), and discussed the end of strategic ambiguity. In Part II, we analyzed the geopolitical importance of Taiwan and China’s military options. In this final report of the three-part series, we will examine the importance of Xi Jinping’s ascendency to power and how he may react. Lastly, we will conclude with market ramifications.
The “Known/Unknowns”: The Issue of Xi Jinping
After laying out several scenarios in Part II discussing actions that China might take, we determined the quarantine/blockade scenario had the greatest benefits compared to the risks. However, our assessment is from the perspective of an analyst, not from a leader. The calculus of a leader can be different based on the experience of that leader and the political conditions they operate within. In other words, our task now is to assess how Xi will behave in this situation. While we have no personal insight into General Secretary Xi’s decision-making, we can observe his behavior and current circumstances to estimate the risks stemming from his actions.
Asset Allocation Weekly – #38 (Posted 5/14/21)
Asset Allocation Weekly (May 14, 2021)
by the Asset Allocation Committee | PDF
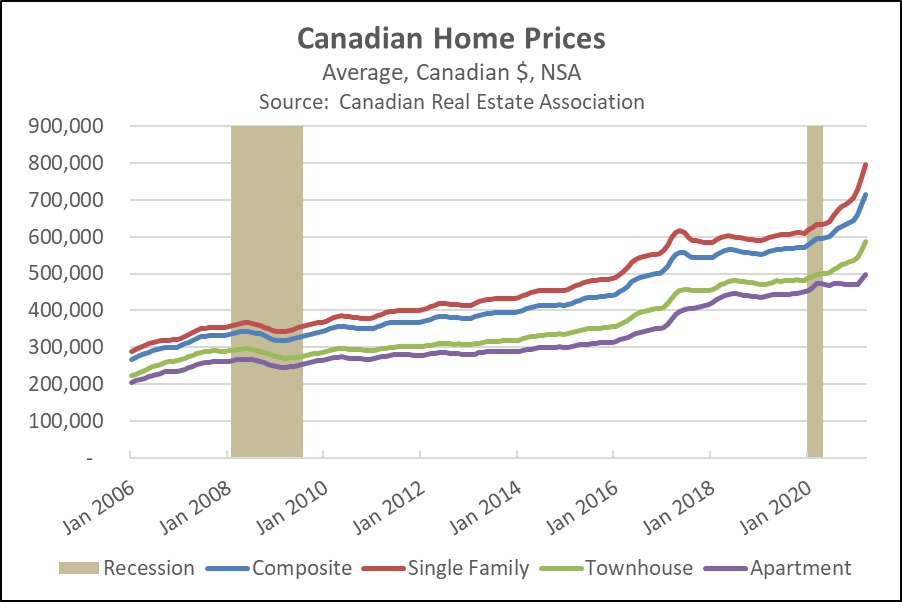
Since the Great Financial Crisis of 2007-2008 (GFC), any rapid rise in home prices has tended to spark fears of another bubble bursting. U.S. home prices have recently been up more than 10% from one year earlier, marking their strongest gains since the recovery period right after the GFC. However, those gains have been overshadowed by the even bigger increases in Canada. Home prices north of the border rose 13% in the year ended December 2020, and they were up an even stronger 20.1% in the 12 months ended March 2021 (see chart). Does that mean the Canadian housing market is in a bubble? What’s the risk that Canadian home prices will crash back to earth, dragging down the financial system and Canadian stocks?
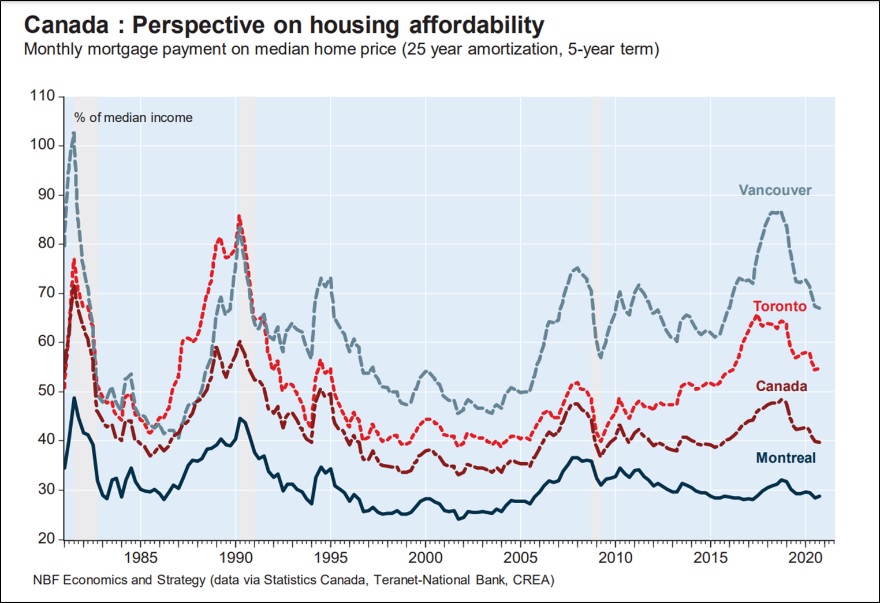
One reassuring sign is that Canadian homes are still affordable despite the recent price surge. Based on today’s median home price, mortgage interest rates, and typical Canadian mortgage terms, a homebuyer’s monthly mortgage payment would equal only about 40% of the country’s median income. As shown in the following chart, that’s similar to the level seen during most of the last decade. It’s also much lower than in the 1980s and 1990s. Naturally, housing costs can be much higher in major metropolitan areas. However, even in those locales, affordability has improved over the last few years. That’s because the recent price hikes have been largely offset by falling interest rates and rising incomes. Between 2017 and 2019, price gains were also held in check by tightened regulations, like a new tax on foreigners buying property in Vancouver and Toronto and “stress test” rules requiring loan applicants nationwide to show they could afford their mortgage even if interest rates were 2% higher than when they applied. Current affordability levels suggest Canadian home sellers can still find plenty of buyers.
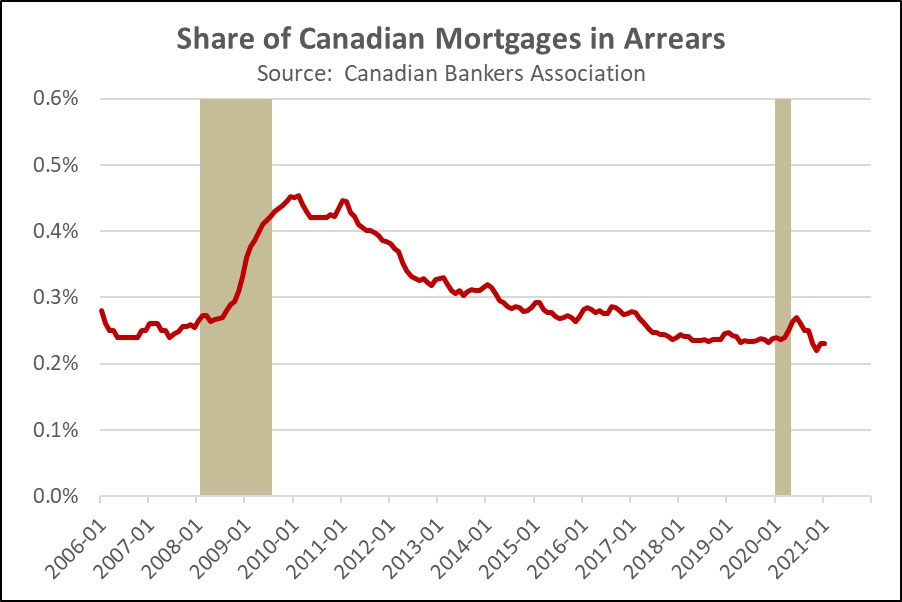
Finally, it’s important to remember that Canadian bank regulations and mortgage terms are much more conservative than in the U.S. The typical Canadian mortgage payment is calculated based on an amortization period of 25 years, and the loan matures in five years, with steep penalties for early refinancing. Long-term homeowners in Canada expect to roll over their mortgage on a strict five-year schedule. Even when homeowners sell their property to buy another, the outstanding balance on the original mortgage is usually applied to the new house. This system helps protect Canadian banks from falling interest rates. In addition, the new stress tests help ensure that borrowers are good credit risks, while government rules discourage banks from selling or securitizing their mortgage loans. The Canadian system therefore tends to keep lenders and homeowners “married” for extended periods, which appears to improve underwriting standards. As evidence of that, the chart below shows that there has been no discernable rise in Canada’s mortgage delinquencies. Canadian mortgage delinquencies remain just a fraction of U.S. delinquencies, despite the recent jump in home prices and increased mortgage debt.
In sum, it appears that the Canadian housing market is responding to the same kinds of pandemic-driven trends facing the U.S. market. Increased desire for personal space, falling mortgage rates, and ample savings have boosted housing demand, even as job fears or health concerns have limited new listings. The boom in Canadian home prices simply doesn’t seem to reflect loose mortgage standards or irresponsible lending, so we are not currently concerned about a housing bubble bursting or causing widespread financial problems north of the border.
Weekly Geopolitical Report – The Geopolitics of Taiwan: Part II (May 10, 2021)
by Bill O’Grady | PDF
In Part I, we covered the history of Taiwan, current relations between the People’s Republic of China (PRC) and the Republic of China (ROC), and closed with the end of strategic ambiguity. This week, we will analyze the geopolitical importance of Taiwan and the PRC’s military options with regard to Taiwan.
The Importance of Taiwan
As background, we consider the situation between China and Japan a “frozen conflict.” The two countries have fought several wars over the past millennia. Since the end of WWII, due to American security guarantees, Japan has demilitarized. The American presence has allowed China and Japan to expand trade relations and investment. The presence of the U.S. in the region means that Japan and China no longer fear for the security of raw material flows. And, they don’t fear each other. However, the current peace between Japan and China relies on the U.S. hegemonic presence. If America leaves, either by choice or by ouster, the age-old conflict between Japan and China will likely return.
By the same token, the Korean peninsula has been under the control of China or Japan on numerous occasions over history. It is reasonable to assume that if the U.S. presence is reduced, the Koreas will likely face pressure from China and maybe Japan.
The control of Taiwan is critical to the geopolitical situation of the Koreas, Japan, and the Pacific region. Perhaps the clearest expression of the geopolitical importance of Taiwan comes from the late Gen. Douglass MacArthur.
Asset Allocation Weekly – #37 (Posted 5/7/21)
Asset Allocation Weekly (May 7, 2021)
by the Asset Allocation Committee | PDF
Yogi Berra is famous for various quotes. He famously said, “Always go to other people’s funerals, otherwise, they won’t come to yours.” He also noted that, “A nickel isn’t worth a dime anymore.” The one we deal with most in asset allocation is the saying, “It’s tough to make predictions, especially about the future.” But, as Hyman Roth remarked, “This is the business we have chosen.”
So, how do we make predictions? Our asset allocation process uses a committee approach and gives each member the freedom to create their own methodologies to arrive at their forecasts. This system has worked out reasonably well, in part because there is enough diversity of methods and opinions to cover a wide range of possibilities. From there, the committee comes to a consensus about the return, risk, and yield of 12 different asset classes.
One way to examine this issue is to adapt a tool from psychology called the “Johari Window.”
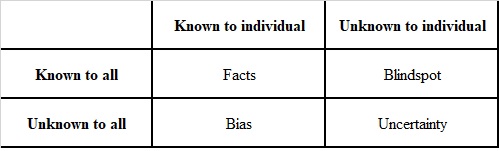
This scheme was used by Secretary of Defense Rumsfeld in his famous “known-unknowns” press conference. For our purposes, the “Facts” quadrant, quadrant one, is essentially history. This quadrant contains factual information—what we know is true. The second quadrant, “Blindspot,” is the area of known-unknowns. This is where we know a factor is important, but we don’t know what the outcome will be quite yet. This is the area of risk, where some degree of probability can be assigned. The other two quadrants are “Bias” and “Uncertainty.” Quadrant four, the uncertainty zone, is where we are not even aware of the outstanding risks. The third quadrant, the zone of bias, is where we think we know something but, in fact, we don’t.
To a great extent, quadrants three and four are where the problems lie. Of the two, bias is probably the most dangerous. This is the region of belief. John Maynard Keyes summed up this issue with the following quote:
Practical men, who believe themselves to be quite exempt from any intellectual influence, are usually the slaves of some defunct economist. Madmen in authority, who hear voices in the air, are distilling their frenzy from some academic scribbler of a few years back.[1]
This is where narratives can dominate thinking and blind us to other possible outcomes. It is probably impossible to be a bias-free human. All of us carry self-evident truths that help us manage our lives. The key point is to be aware of them. One of the benefits of a committee structure, at least one with enough diversity, is that the bias risk can be offset by having “competing biases.” An even more effective committee can help each member become more aware of their individual biases as well.
Quadrant four, the area of the unknown, can only be divined by intuition. For the most part, this is the area where events haven’t happened before or occur so infrequently that there isn’t much history to work with. It isn’t impossible to predict these outcomes, but it isn’t easy. And, it is nearly impossible to get it right consistently. The history of markets is littered with analysts who were “one-hit wonders,” having made a great call once without repetition. A process in which multiple participants intuit the unknown at least offers the chance of a correct assessment.
Here is an example using the Johari Window with a current market issue. There is currently great concern about inflation. Here is what we know:
- Money supply growth is at record levels, up 25% on a yearly basis;
- The FOMC has changed its policy to end its primary focus on inflation control;
- Fiscal policy is expanding rapidly.
All these factors would support rising inflation risks. Offsetting these risks are:
- The bulk of cash remains on the balance sheets of the affluent;
- The U.S. economy remains mostly open, meaning that imports can help contain inflation;
- Household debt levels remain elevated and “scarring” from the pandemic will probably keep households cautious about spending.
So, what did the Asset Allocation Committee do, in light of these factors?
- We acknowledged the growing inflation risk well before the current situation. We have had an allocation to precious metals for nearly three years and have utilized bond ladders in portfolios with fixed income. We have also included an allocation to commodities for a year now.
- At the same time, given the distribution of cash, there is a chance that asset inflation could occur, at least in the near term. Price inflation will need less inequality. Thus, we are overweight equities.
- We also expect that policy will lead to a weaker dollar, and so we hold a sizeable allocation to international equities.
Essentially, Confluence’s asset allocation process attempts to take what we know and assess the quantifiable risks, based on history, consider what might happen that is uncertain, and make sure we don’t assume outcomes that may not be consistent with what we know.
[1] Keynes, John M. (1936). The General Theory of Employment, Interest, and Money. New York, NY: Harcourt, Brace, Jovanovich. (p. 383)
Weekly Geopolitical Report – The Geopolitics of Taiwan: Part I (May 3, 2021)
by Bill O’Grady | PDF
Tensions over Taiwan have been steadily escalating in recent years. When President Trump was elected in 2016, one of the first official contacts he made was with President Tsai Ing-wen, the leader of Taiwan. Accepting this call infuriated Beijing, which views Taiwan as a province of the People’s Republic of China (PRC). Recently, there have been alerts from American military officials warning that China has hostile designs on Taiwan. Chinese warplanes regularly enter Taiwan’s airspace, normalizing this hostility.
There are numerous subcurrents in Asia; the predominant one is that China no longer accepts U.S. hegemony in the region and seeks to become the dominant power of that continent.[1] However, having the goal of hegemony and becoming a hegemon are two different issues. The size of China’s economy clearly makes it a world power. The country has been rapidly building its military to compete with the U.S. At the same time, it has serious vulnerabilities that prevent it from ousting America from the Pacific region.
Taiwan encapsulates many of the issues surrounding China’s goal of hegemony. In this report, we will examine them in depth. In a subsequent report, my colleague, Patrick Fearon-Hernandez, will build off this research to examine the global semiconductor industry which has much of its critical infrastructure in Taiwan. To some extent, the geopolitics of Taiwan, in general, and the semiconductor industry, specifically, detail the current situation surrounding globalization. As globalization comes under strain, the stresses are being exhibited clearly in Taiwan and in semiconductors.[2]
In Part I of this report, we will begin with a history of Taiwan. Next, we will address current relations between the PRC and the Republic of China (ROC) and the end of strategic ambiguity. In Part II, we will analyze the geopolitical importance of Taiwan and China’s military options. In Part III, we will examine how Xi Jinping may react, in light of his ascendency to power. Finally, we will conclude with market ramifications.
[1] Allison, Graham. (2017). Destined for War: Can America and China Escape Thucydides’s Trap? New York, NY: Houghton, Mifflin, Harcourt. Our review of the book and concept can be found here and here.
[2] Because these reports touch on not just macroeconomic and geopolitical issues, but will also discuss industries and companies, we want to acknowledge the support and counsel provided by our colleagues at Confluence Investment Management on the Value Equities and International Equities Investment Committees. Dan Winter, Matt Sinkovitz, Mark Keller, Joe Hanzlik, and Greg Tropf provided insight and information in our research. While acknowledging their contributions, any errors and omissions in this report are mine alone and the research reflects my sole conclusions.