by Asset Allocation Committee | PDF
With the U.S. dollar apparently poised for what could be a long phase of depreciation, investors are naturally looking more closely at foreign stocks for future growth. Japan has been a prime focus, not only because it sports the world’s third-largest economy and the third-largest equity market, but also because Japanese stocks have recently performed well. Over the last six months, for example, the MSCI Japan Index provided a total return of 17.3% (in dollar terms), almost double the return on the U.S. index. But are Japanese stocks set for further gains over the long term? Have Japanese stocks really overcome their long period of underperformance since the country’s “bubble economy” burst more than 30 years ago? A close look at the Japanese economy and financial markets shows Japan has certain cyclical advantages that investors could currently take advantage of, but it is also facing longer-term headwinds that are likely to weigh on returns over time.
Countries that go through an investment bubble like Japan did in the 1980s are left with the challenge of adjustment once the bubble bursts. Among the many possible strategies to deal with the excess investment and resulting overcapacity, the government can simply step back and allow asset prices to quickly adjust downward, putting lots of people out of work and leaving creditors empty-handed. After the pain of the Great Depression, governments these days more often try to slow the process and spread the costs broadly. Our analysis suggests Japan completed the slow process of repricing its assets and working through its excess investment in the early part of this century. In the chart below, which shows the inflation-adjusted growth rate for each major category of Japan’s gross domestic product (GDP) by period, the red columns show how fixed investment swung dramatically from an average annual increase of 5.5% in the 1980s to average annual declines of 0.4% through the 1990s and 2.1% in the first decade of the 2000s. However, the chart shows that Japanese investment finally started to grow again in about 2010 (we’ve excluded the data for 2020, since it is distorted by the coronavirus pandemic).
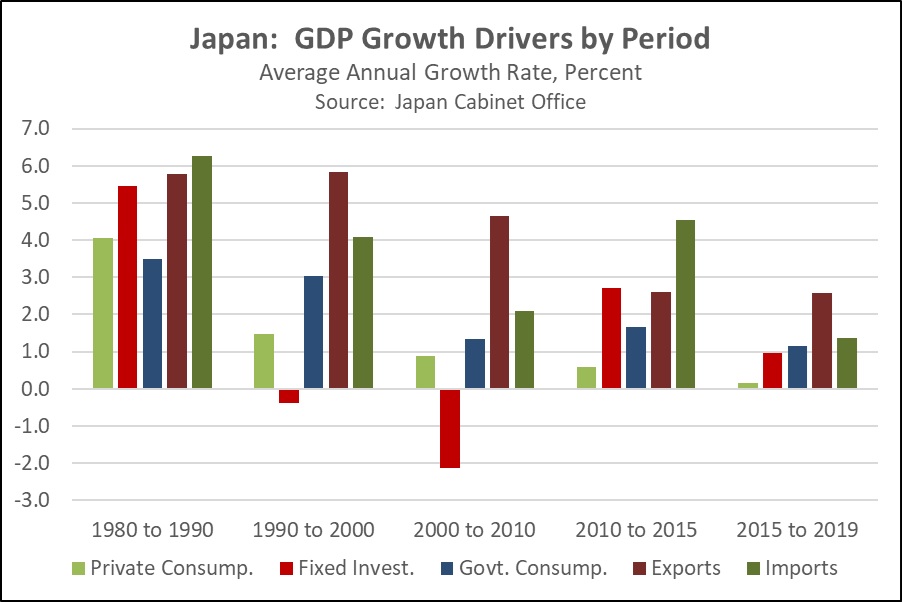
Besides the rebound in investment, Japan has also recently shown other improvements in economic policy and dynamics. For example, the country has deepened its economic ties to China, helping boost its exports. It has improved its corporate governance rules and brought more people into the workforce. All the same, the chart above suggests why its stock market performance remained weak until recently. As is typical for highly developed countries, personal consumption spending is the biggest driver of Japan’s economy, but the chart shows that this type of spending has been growing ever more slowly, even after investment rebounded and labor force participation increased. This critical slowdown in consumer spending almost certainly reflects Japan’s major problem with low birth rates, a shrinking population, and population aging. Taking a “glass half full” approach, you could say that the rebound in Japanese investment has come just in time to offset some of the country’s poor demographics. From a “glass half empty” perspective, you could also argue that the positive impact of Japan’s investment rebound is being offset by worsening consumer spending trends.
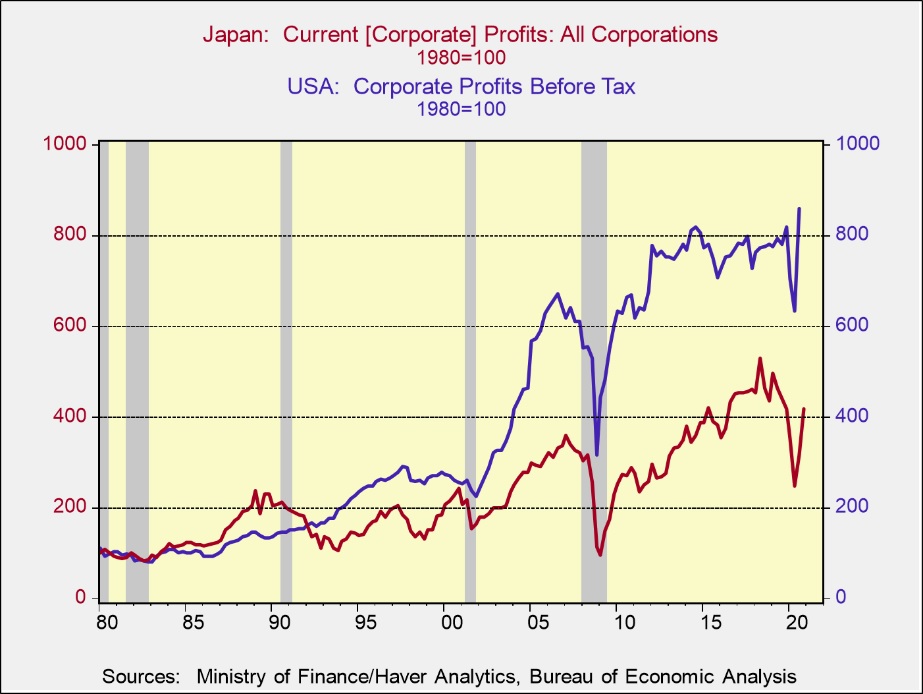
The back-to-back problems of asset price adjustments and demographics have presented a continuing challenge for Japanese companies. In addition, government policymakers have been unable to come up with ways to address the situation. In some ways, they’ve even exacerbated it (especially by raising the national value-added levy, a type of sales tax). As shown in the chart below, Japanese corporate profits have trended upward since the bursting of the bubble economy, but the average rate of increase has been anemic at about 2.5% per year, versus 7.5% per year in the U.S.
Because of its enormous economy and financial markets, Japan can’t be ignored by investors, but this analysis shows that the country continues to face big challenges to its economic growth and corporate profitability. In the short term, we do think Japanese stocks could continue their recent short-term cyclical rebound because of factors like its corporate governance improvements, investors’ shift toward the “value” stocks that make up so much of the market, or the post-pandemic economic rebound around the world, which is boosting Japanese exports. In the long term, however, it’s important to remember that Japanese stocks will probably continue to face continuing secular challenges from its poor demographics.